

Answered step by step
Verified Expert Solution
Question
1 Approved Answer
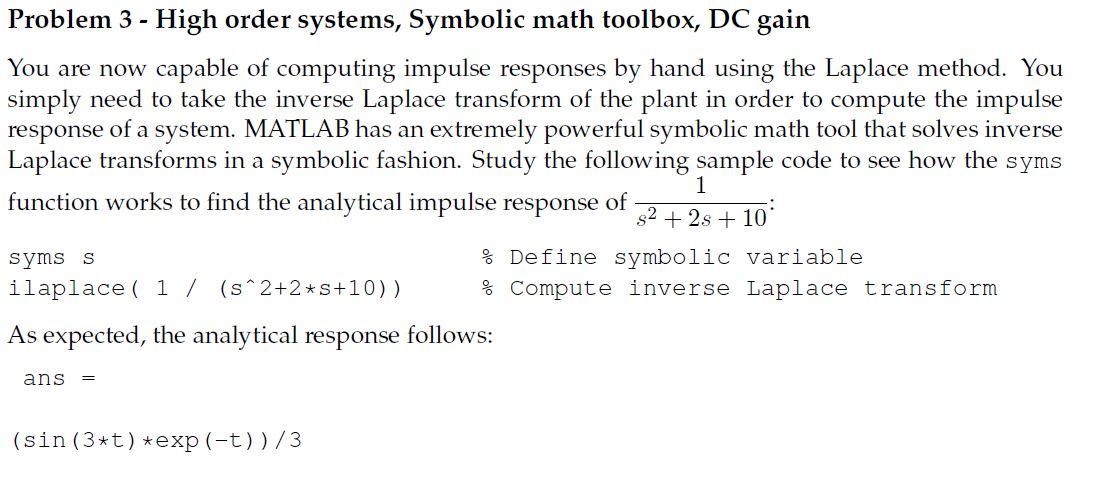
Problem 3 - High order systems, Symbolic math toolbox, DC gain You are now capable of computing impulse responses by hand using the Laplace method.
Step by Step Solution
There are 3 Steps involved in it
Step: 1

Get Instant Access to Expert-Tailored Solutions
See step-by-step solutions with expert insights and AI powered tools for academic success
Step: 2

Step: 3
Ace Your Homework with AI
Get the answers you need in no time with our AI-driven, step-by-step assistance
Get Started
Database Reliability Engineering Designing And Operating Resilient Database Systems
Authors: Laine Campbell, Charity Majors
1st Edition
978-1491925942