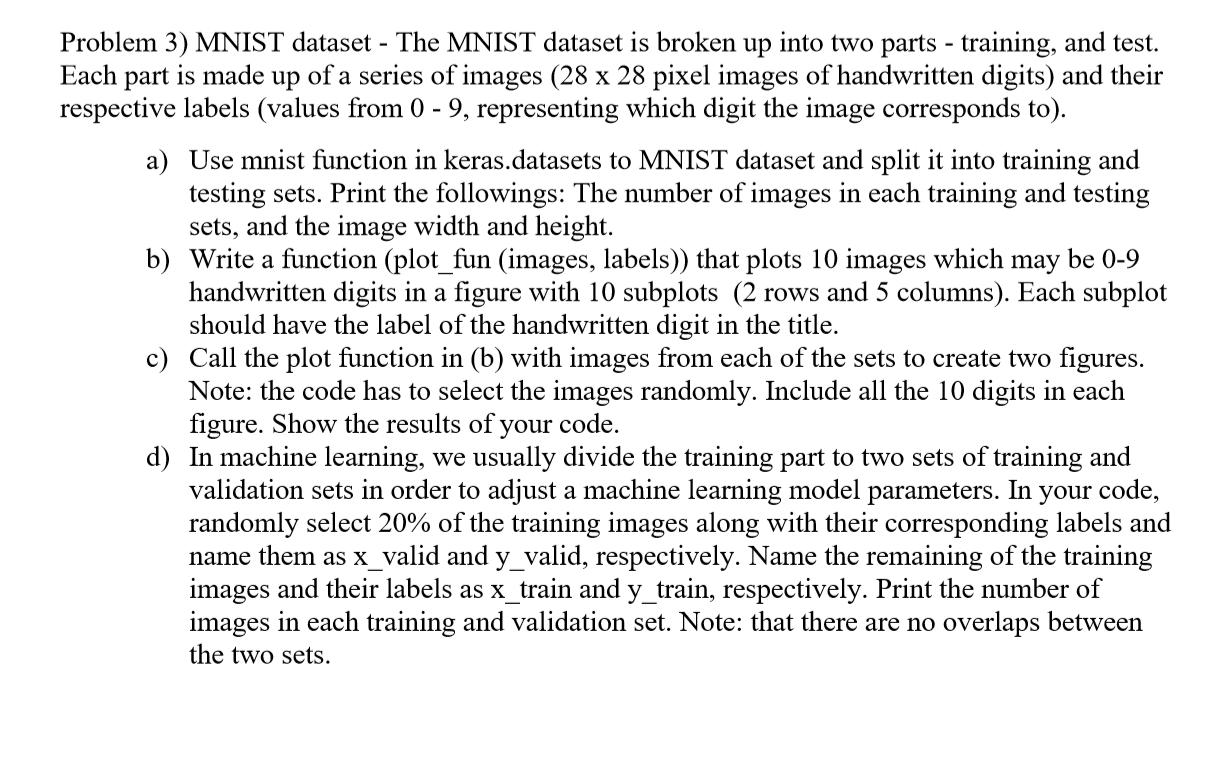
Question: Problem 3) MNIST dataset - The MNIST dataset is broken up into two parts - training, and test. Each part is made up of a

Problem 3) MNIST dataset - The MNIST dataset is broken up into two parts - training, and test. Each part is made up of a series of images (28 x 28 pixel images of handwritten digits) and their respective labels (values from 0 - 9, representing which digit the image corresponds to). a) Use mnist function in keras.datasets to MNIST dataset and split it into training and testing sets. Print the followings: The number of images in each training and testing sets, and the image width and height. b) Write a function (plot_fun (images, labels)) that plots 10 images which may be 0-9 handwritten digits in a figure with 10 subplots (2 rows and 5 columns). Each subplot should have the label of the handwritten digit in the title. c) Call the plot function in (b) with images from each of the sets to create two figures. Note: the code has to select the images randomly. Include all the 10 digits in each figure. Show the results of your code. In machine learning, we usually divide the training part to two sets of training and validation sets in order to adjust a machine learning model parameters. In your code, randomly select 20% of the training images along with their corresponding labels and name them as x_valid and y_valid, respectively. Name the remaining of the training images and their labels as x_train and y_train, respectively. Print the number of images in each training and validation set. Note: that there are no overlaps between the two sets. Problem 3) MNIST dataset - The MNIST dataset is broken up into two parts - training, and test. Each part is made up of a series of images (28 x 28 pixel images of handwritten digits) and their respective labels (values from 0 - 9, representing which digit the image corresponds to). a) Use mnist function in keras.datasets to MNIST dataset and split it into training and testing sets. Print the followings: The number of images in each training and testing sets, and the image width and height. b) Write a function (plot_fun (images, labels)) that plots 10 images which may be 0-9 handwritten digits in a figure with 10 subplots (2 rows and 5 columns). Each subplot should have the label of the handwritten digit in the title. c) Call the plot function in (b) with images from each of the sets to create two figures. Note: the code has to select the images randomly. Include all the 10 digits in each figure. Show the results of your code. In machine learning, we usually divide the training part to two sets of training and validation sets in order to adjust a machine learning model parameters. In your code, randomly select 20% of the training images along with their corresponding labels and name them as x_valid and y_valid, respectively. Name the remaining of the training images and their labels as x_train and y_train, respectively. Print the number of images in each training and validation set. Note: that there are no overlaps between the two sets
Step by Step Solution
There are 3 Steps involved in it

Get step-by-step solutions from verified subject matter experts


