Answered step by step
Verified Expert Solution
Question
1 Approved Answer
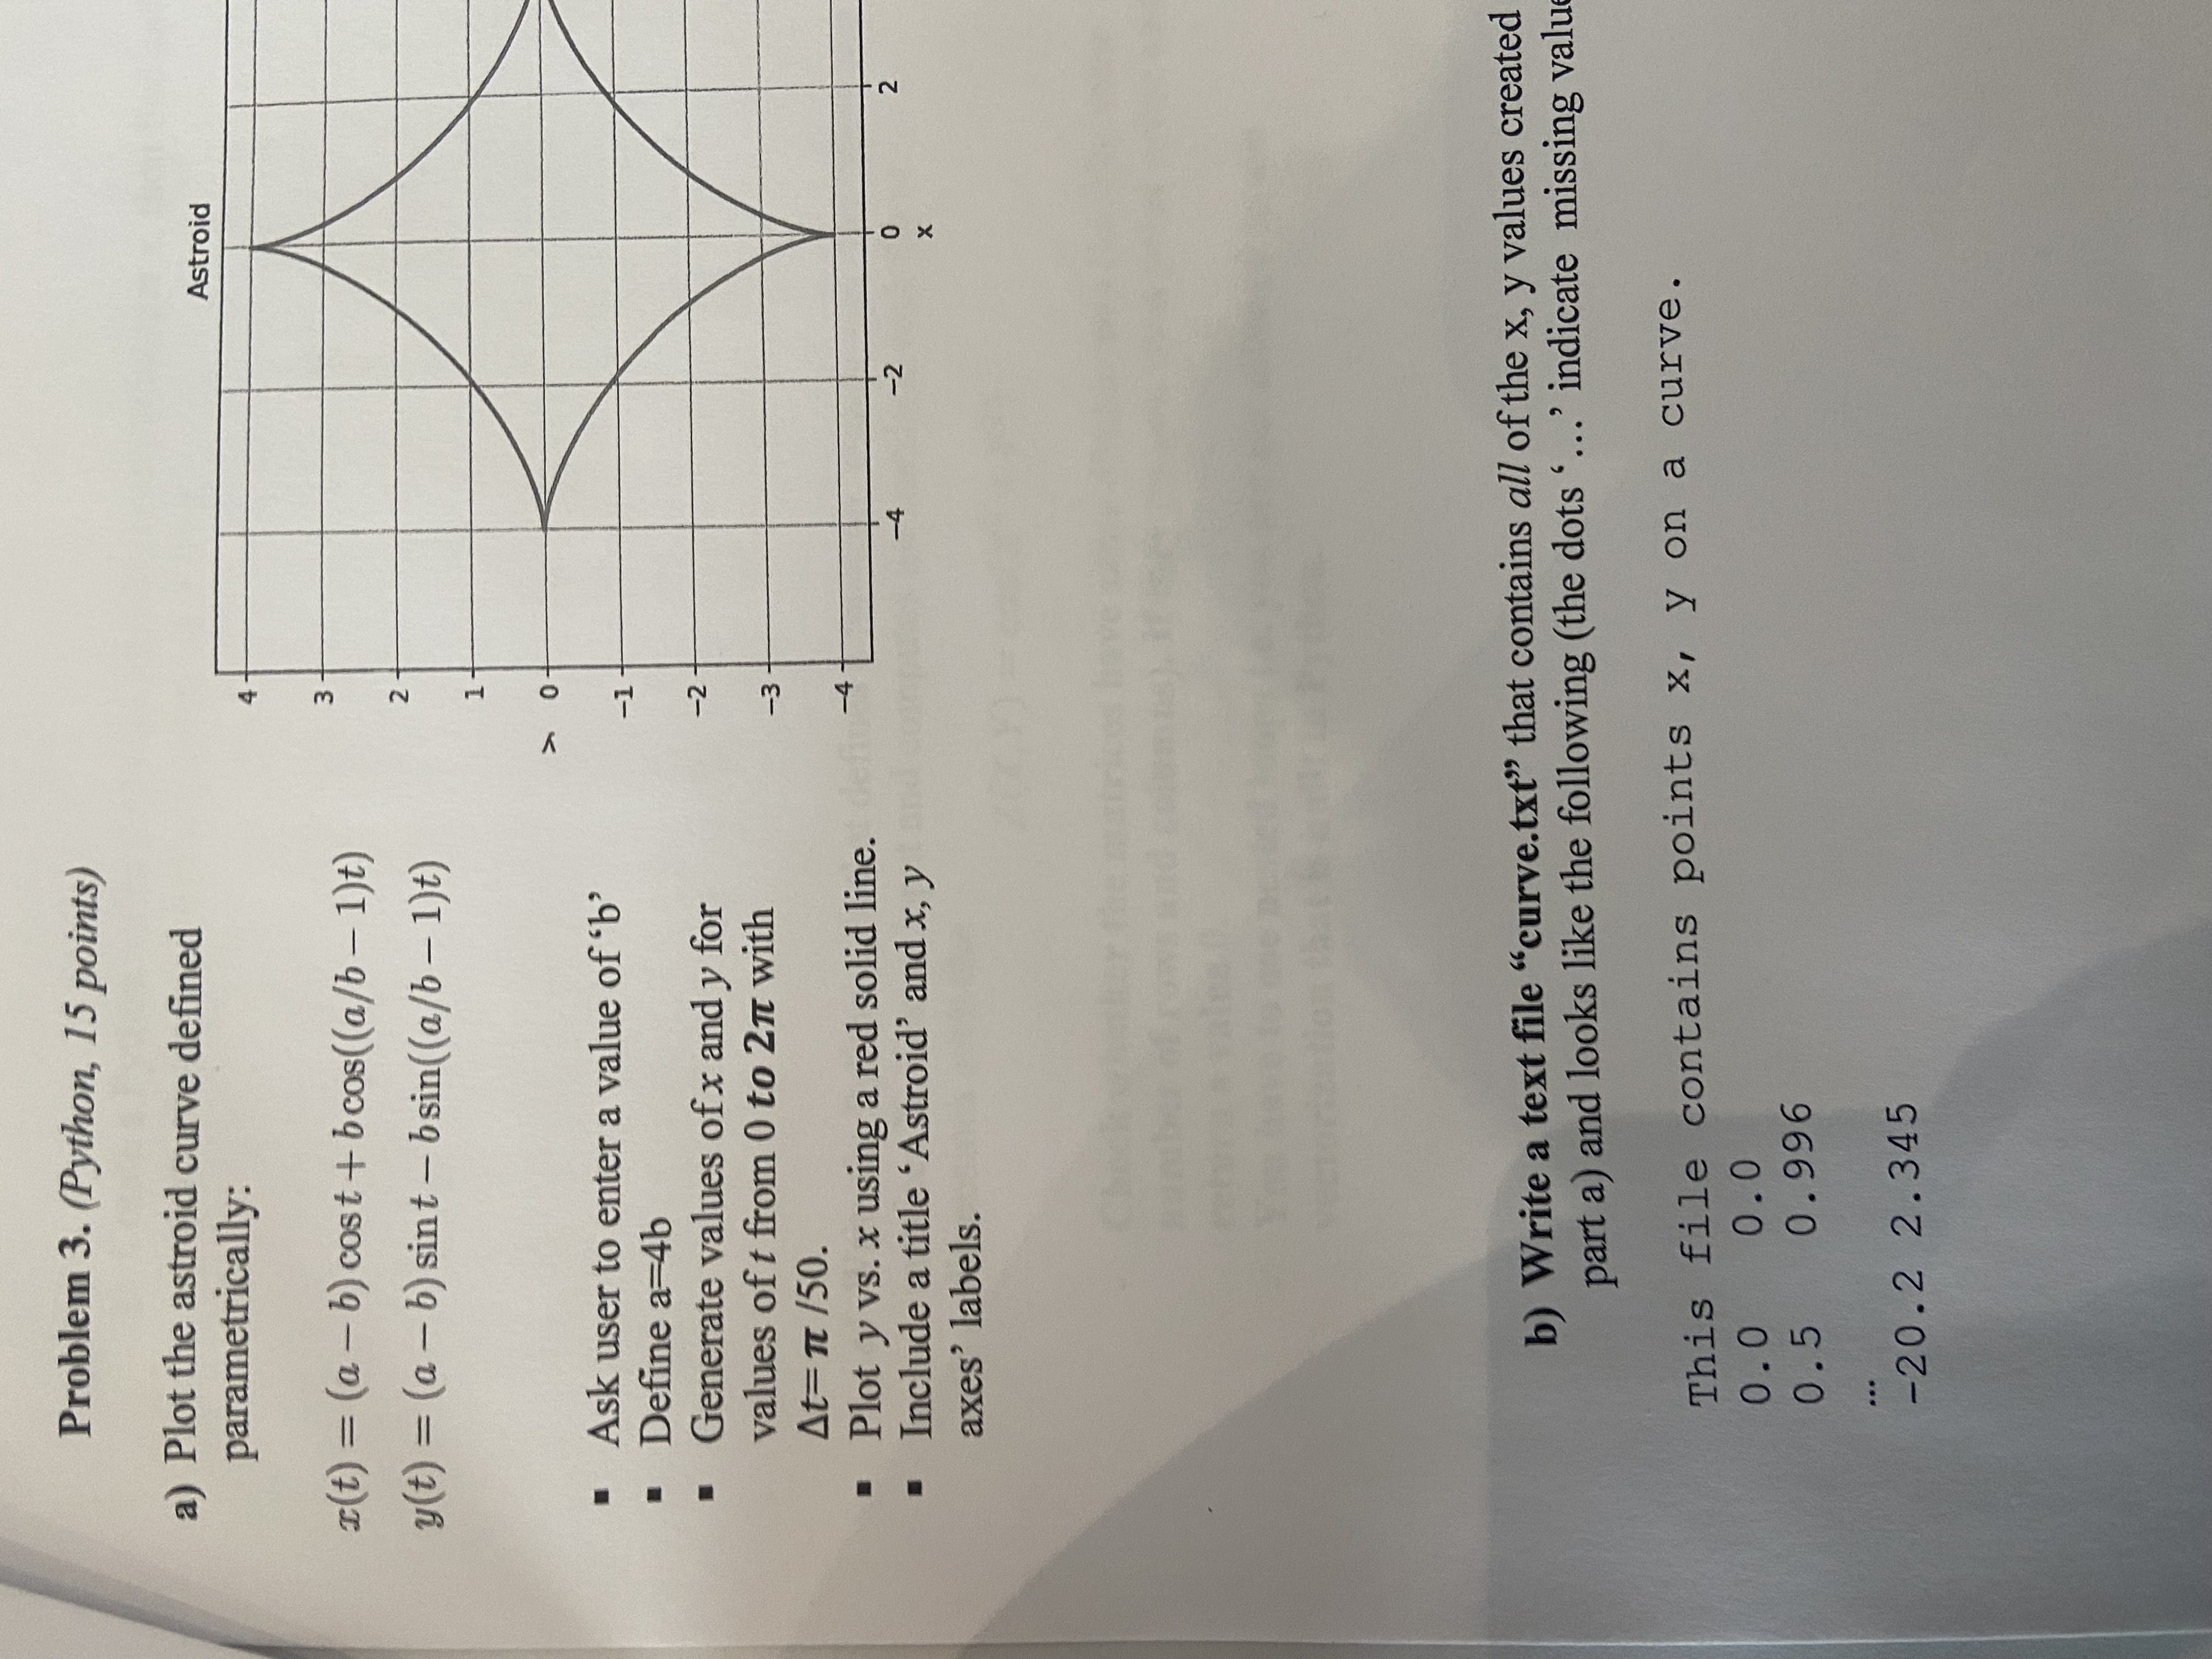
Problem 3. (Python, 15 points) a) Plot the astroid curve defined Astroid parametrically: 3 I(t) = (a - b) cost + bcos((a/b - 1)t) N

Problem 3. (Python, 15 points) a) Plot the astroid curve defined parametrically: r(t) = (ab) cost+ bcos((a/b 1)t) y(t)= (a - b) sint - bsin((a/b 1)t) Ask user to enter a value of 'b' Define a=4b Generate values of x and y for values of t from 0 to 2 with At= /50. Plot y vs. x using a red solid line. Include a title 'Astroid' and x, y axes' labels. y 3 -20.2 2.345 2 1 0 -1 -2 -3 -4 -4 -2 Astroid This file contains points x, y on a curve. 0.0 0.0 0.5 0.996 OX 0 b) Write a text file "curve.txt" that contains all of the x, y values created part a) and looks like the following (the dots ..' indicate missing value 2
Step by Step Solution
There are 3 Steps involved in it
Step: 1

Get Instant Access to Expert-Tailored Solutions
See step-by-step solutions with expert insights and AI powered tools for academic success
Step: 2

Step: 3

Ace Your Homework with AI
Get the answers you need in no time with our AI-driven, step-by-step assistance
Get Started


