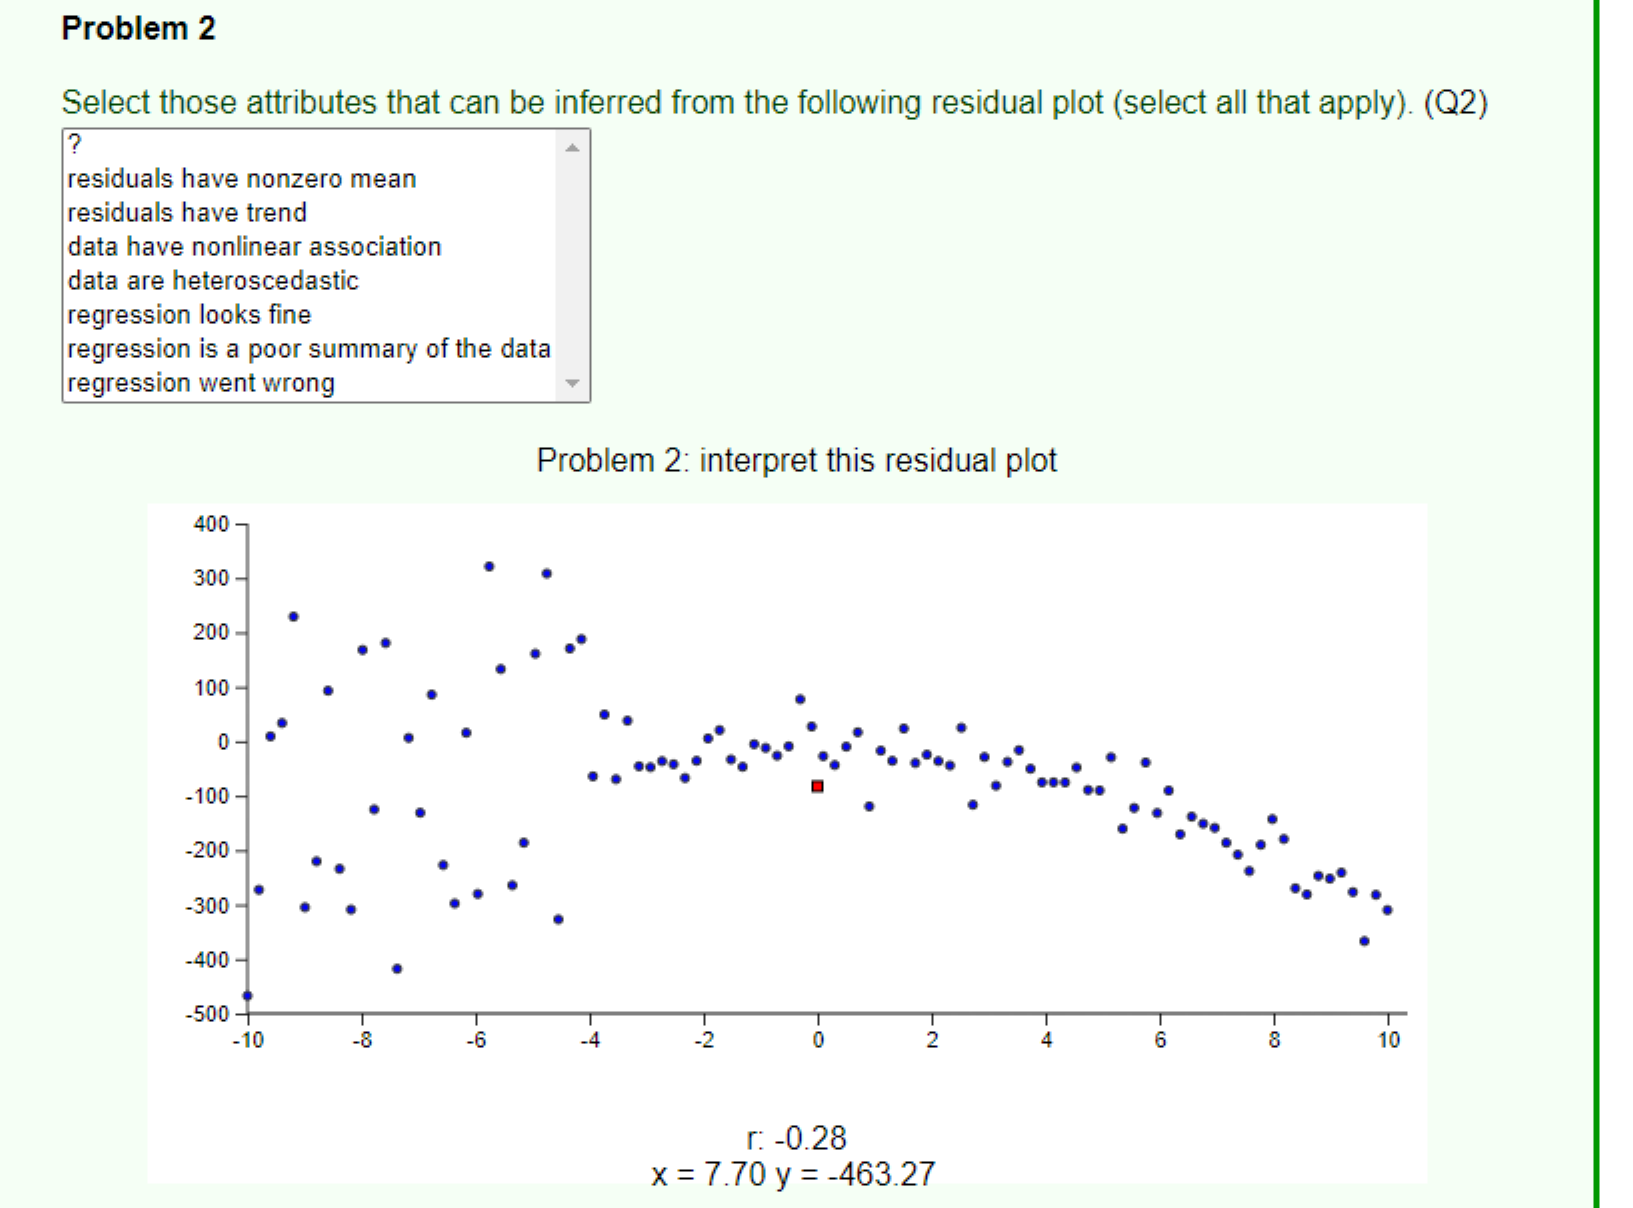
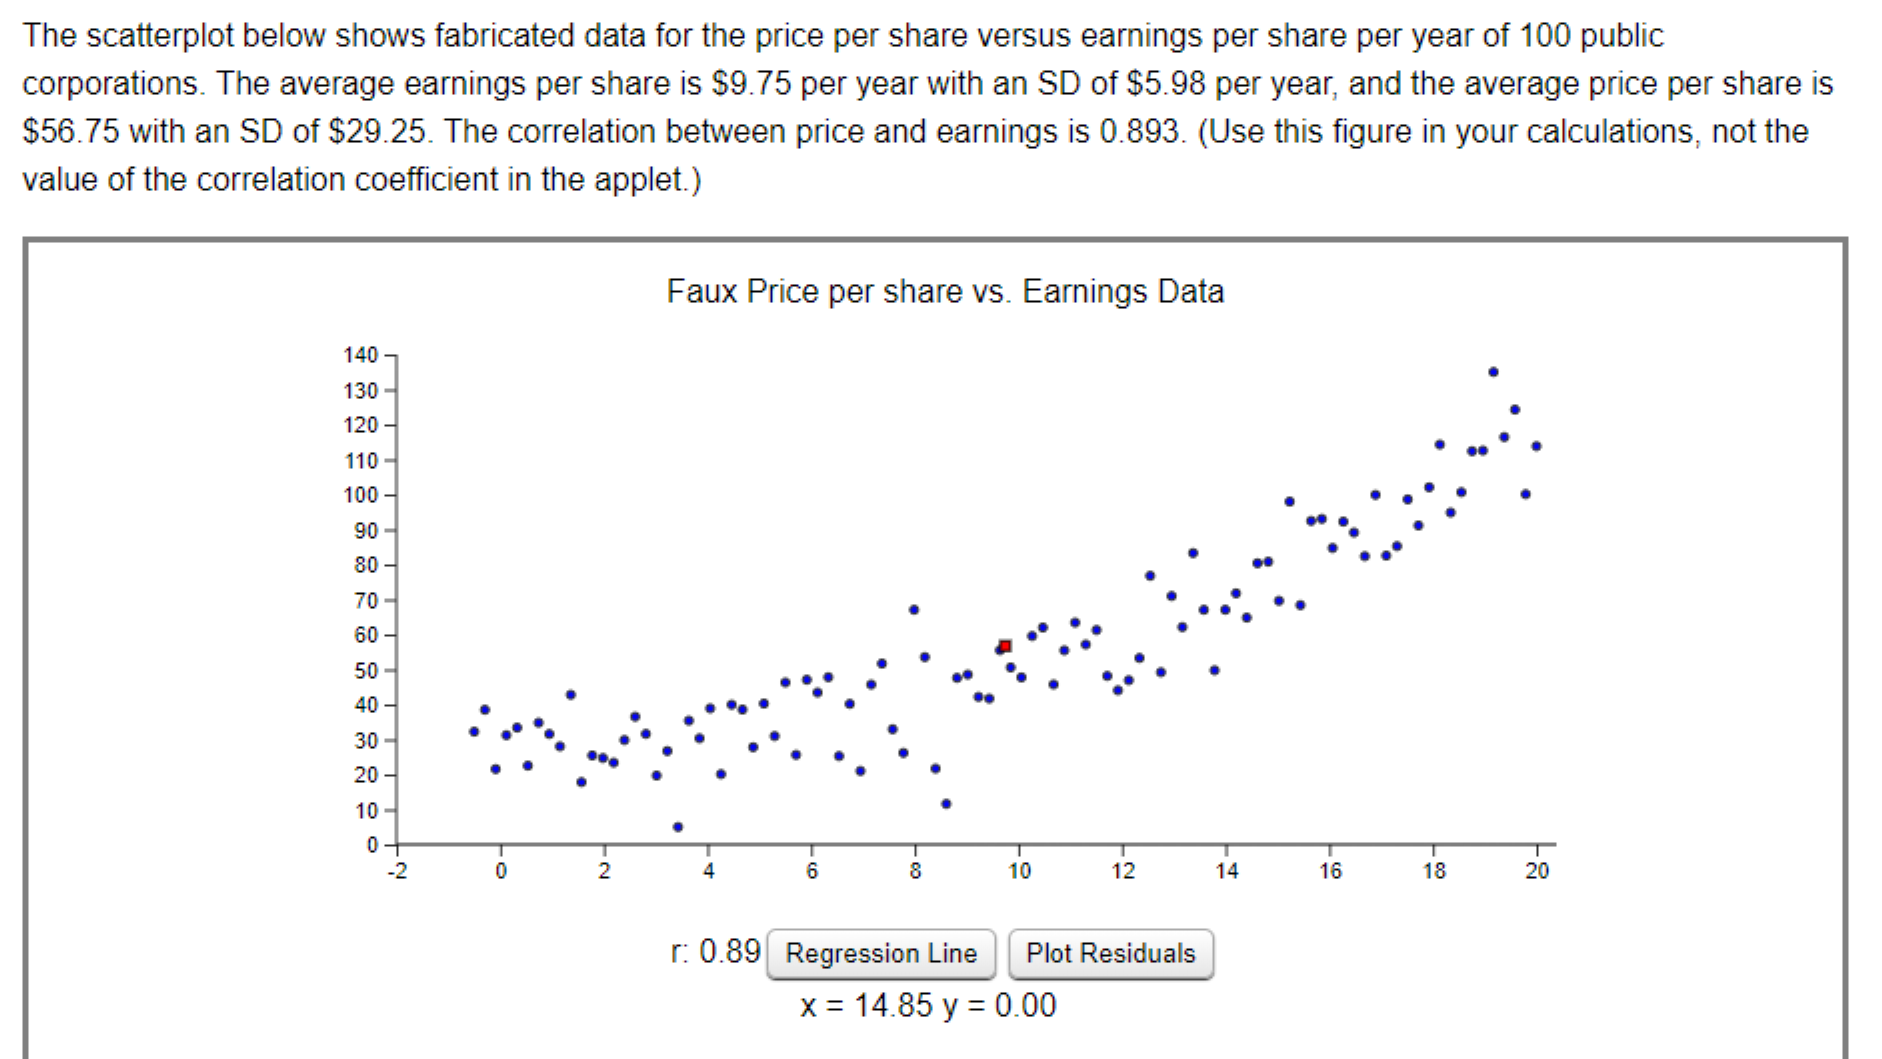
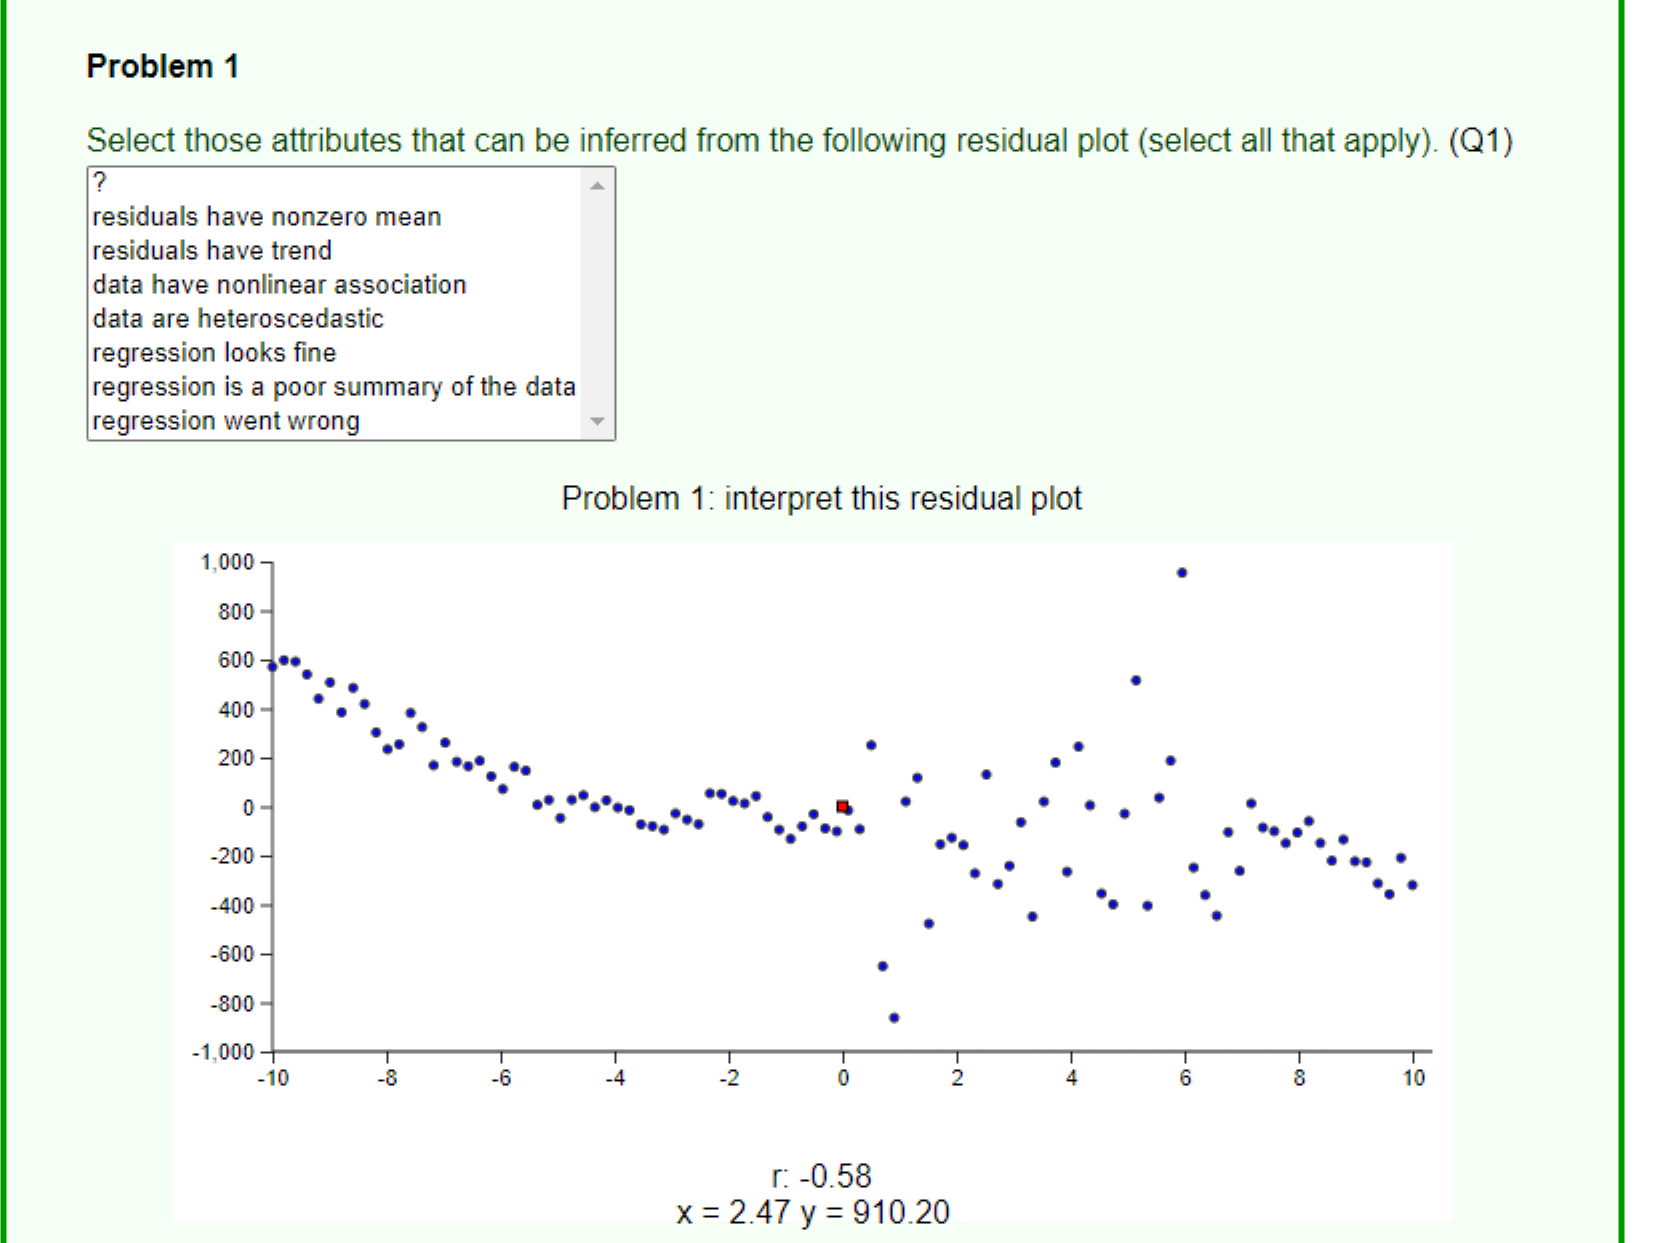
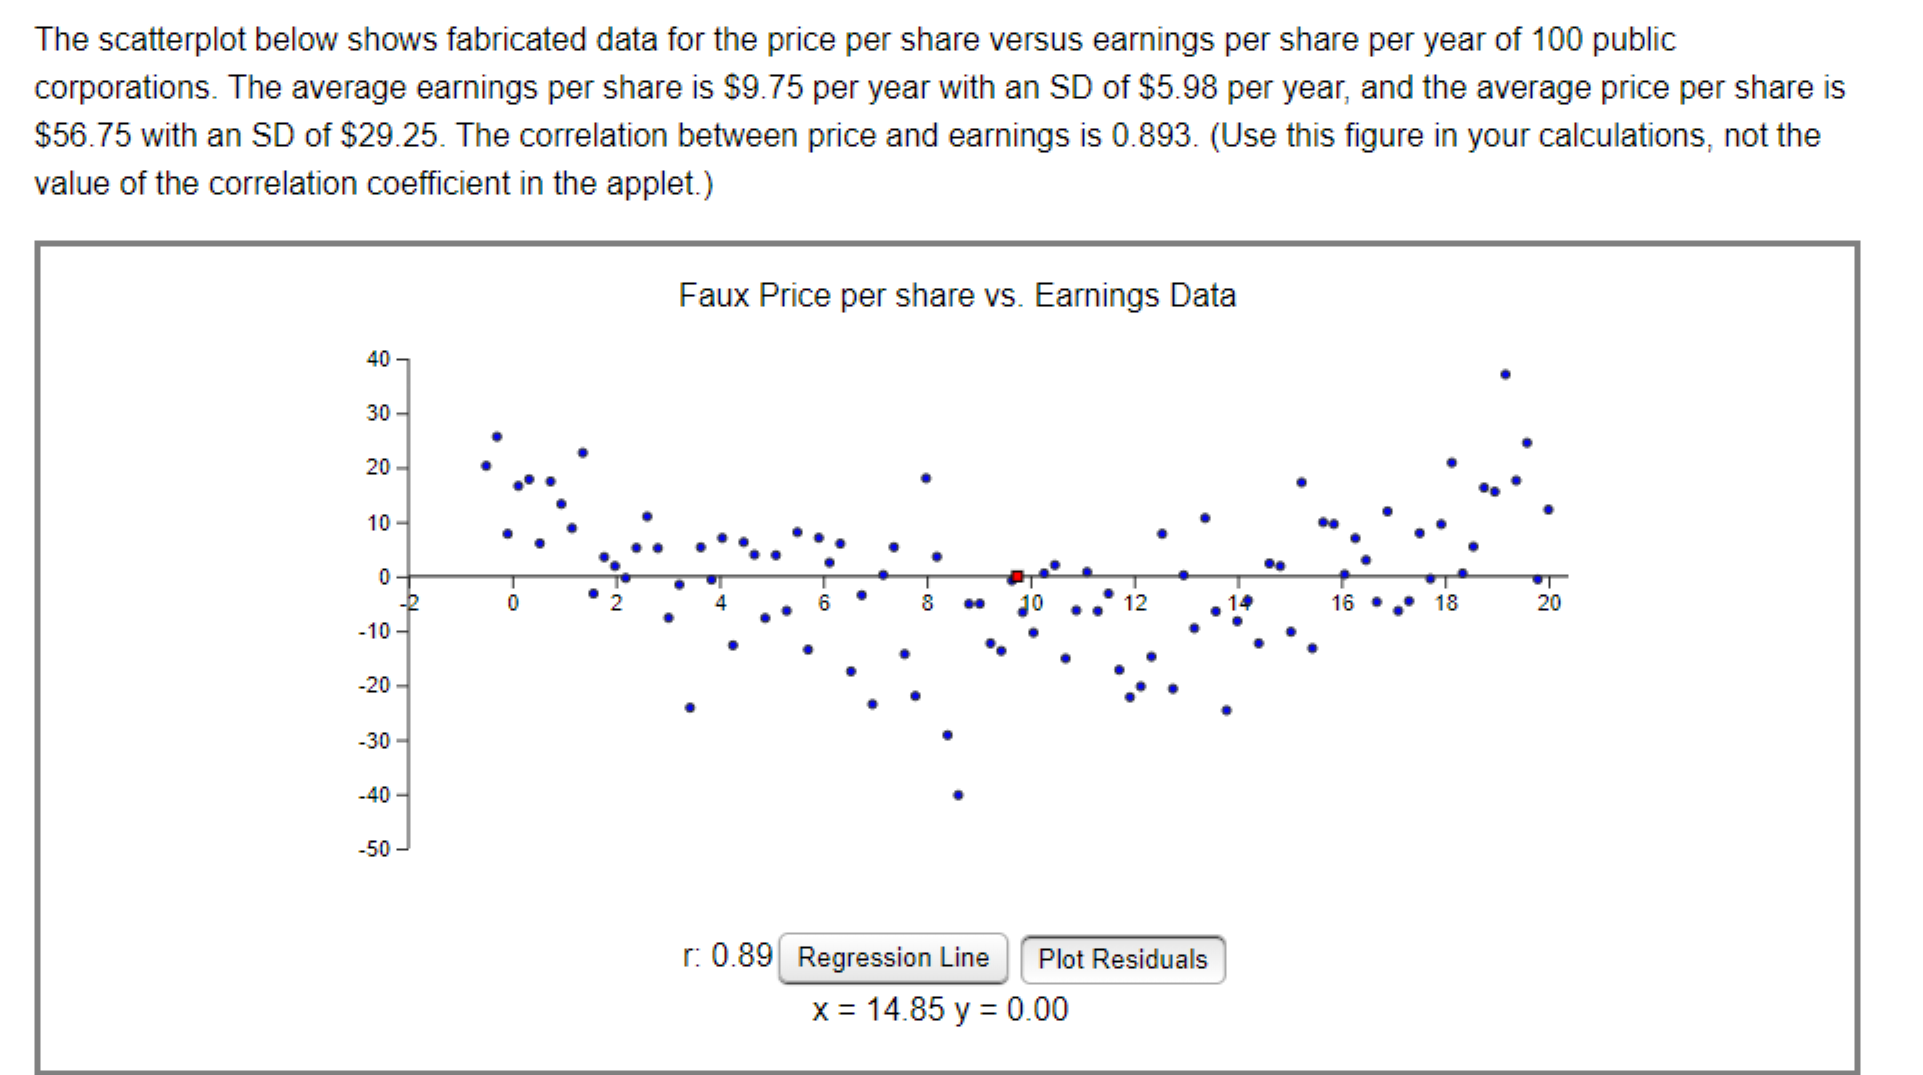
Problem 3 The regression line estimate of the price per share of a company whose annual earnings per share is $44.17 is s (03) :| Problem 2 Select those attributes that can be inferred from the following residual plot (select all that apply). (02) ? residuals have nonzero mean residuals have trend data have nonlinear association data are heteroscedastic regression looks ne regression is a poor summary of the data regression went wrong v Problem 2: interpret this residual plot r: -0.28 x = 7.70 y = 463.27 The scatterplot below shows fabricated data for the price per share versus earnings per share per year of 100 public corporations. The average earnings per share is $9.75 per year with an SD of $5.98 per year, and the average price per share is $56.75 with an SD of $29.25. The correlation between price and earnings is 0.893. (Use this figure in your calculations, not the value of the correlation coefficient in the applet.) Faux Price per share vs. Earnings Data 140 130- . 120 - 110 - 100 90 80 - 70 60- 50 - 40 - 30 20 10 0 Co - 10 12 14 16 18 20 r: 0.89 Regression Line Plot Residuals X = 14.85 y = 0.00Problem 1 Select those attributes that can be inferred from the following residual plot (select all that apply). (01) ? residuals have nonzero mean residuals have trend data have nonlinear association data are heteroscedastic regression looks ne regression is a poor summary of the data regression went wrong v Problem 1: interpret this residual plot 1.000 r: -0.58 x = 2.47 y = 910.20 Problem 5 The regression estimate of the price per share of a company whose annual earnings per share is '2 it is extrapolation the data show nonlinear association the data have outliers the data are heteroscedastic $44.17 is (Q5) because (select all that apply) (Q6) none 0fthe above The scatterplot below shows fabricated data for the price per share versus earnings per share per year of 100 public corporations. The average earnings per share is $9.75 per year with an SD of $5.98 per year, and the average price per share is $56.75 with an SD of $29.25. The correlation between price and earnings is 0.893. (Use this figure in your calculations, not the value of the correlation coefficient in the applet.) Faux Price per share vs. Earnings Data 40 30 - 20 - 10 - 0 0 A 8 10 12 16 . 18 20 -10 - -20 - -30 - -40 - -50 r: 0.89 Regression Line Plot Residuals X = 14.85 y = 0.00

