Question
Problem 3. This problem combines hypothesis testing ideas with the material on diagnostic testing. The link is that instead of a diagnostic test that spits
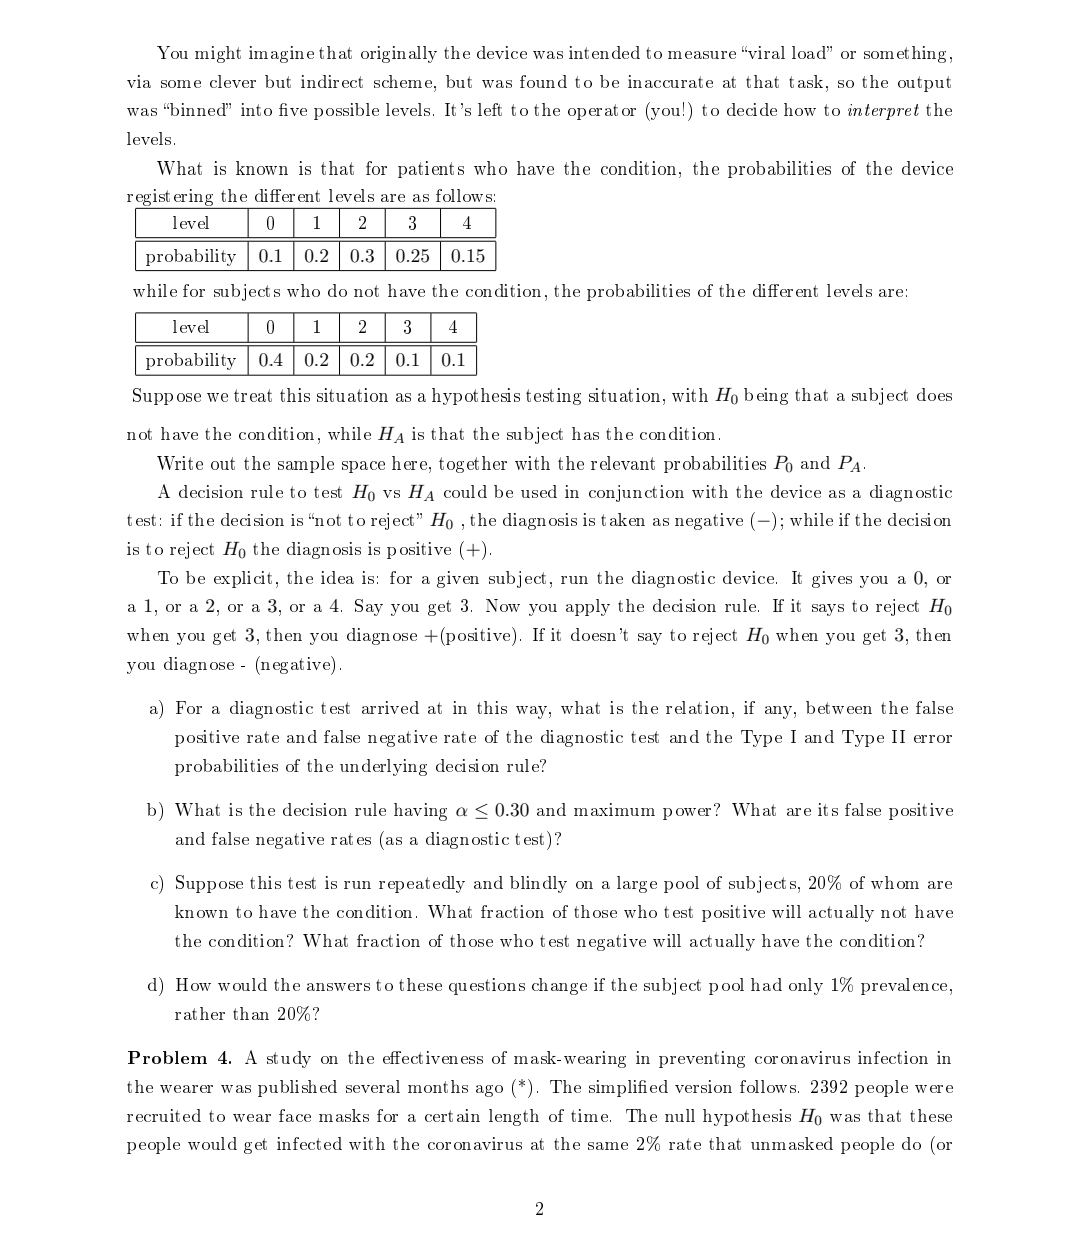
Problem 3. This problem combines hypothesis testing ideas with the material on diagnostic testing.
The link is that instead of a diagnostic test that spits out + or -, we have a diagnostic device
that spits out more quantitative information: a number 0, 1, 2, 3 or 4
You might imagine that originally the device was intended to measure viral load or something,
via some clever but indirect scheme, but was found to be inaccurate at that task, so the output
was binned into ve possible levels. It's left to the operator (you!) to decide how to interpret the
levels.
What is known is that for patients who have the condition, the probabilities of the device
registering the dierent levels are as follows:
level 0 1 2 3 4
probability 0.1 0.2 0.3 0.25 0.15
while for subjects who do not have the condition, the probabilities of the dierent levels are:
level 0 1 2 3 4
probability 0.4 0.2 0.2 0.1 0.1
Suppose we treat this situation as a hypothesis testing situation, with H0 being that a subject does
not have the condition, while HA is that the subject has the condition.
Write out the sample space here, together with the relevant probabilities P0 and PA.
A decision rule to test H0 vs HA could be used in conjunction with the device as a diagnostic
test: if the decision is not to reject H0 , the diagnosis is taken as negative (?); while if the decision
is to reject H0 the diagnosis is positive (+).
To be explicit, the idea is: for a given subject, run the diagnostic device. It gives you a 0, or
a 1, or a 2, or a 3, or a 4. Say you get 3. Now you apply the decision rule. If it says to reject H0
when you get 3, then you diagnose +(positive). If it doesn't say to reject H0 when you get 3, then
you diagnose - (negative).
a) For a diagnostic test arrived at in this way, what is the relation, if any, between the false
positive rate and false negative rate of the diagnostic test and the Type I and Type II error
probabilities of the underlying decision rule?
b) What is the decision rule having ? ? 0.30 and maximum power? What are its false positive
and false negative rates (as a diagnostic test)?
c) Suppose this test is run repeatedly and blindly on a large pool of subjects, 20% of whom are
known to have the condition. What fraction of those who test positive will actually not have
the condition? What fraction of those who test negative will actually have the condition?
d) How would the answers to these questions change if the subject pool had only 1% prevalence,
rather than 20%?

Step by Step Solution
There are 3 Steps involved in it
Step: 1

Get Instant Access to Expert-Tailored Solutions
See step-by-step solutions with expert insights and AI powered tools for academic success
Step: 2

Step: 3

Ace Your Homework with AI
Get the answers you need in no time with our AI-driven, step-by-step assistance
Get Started


