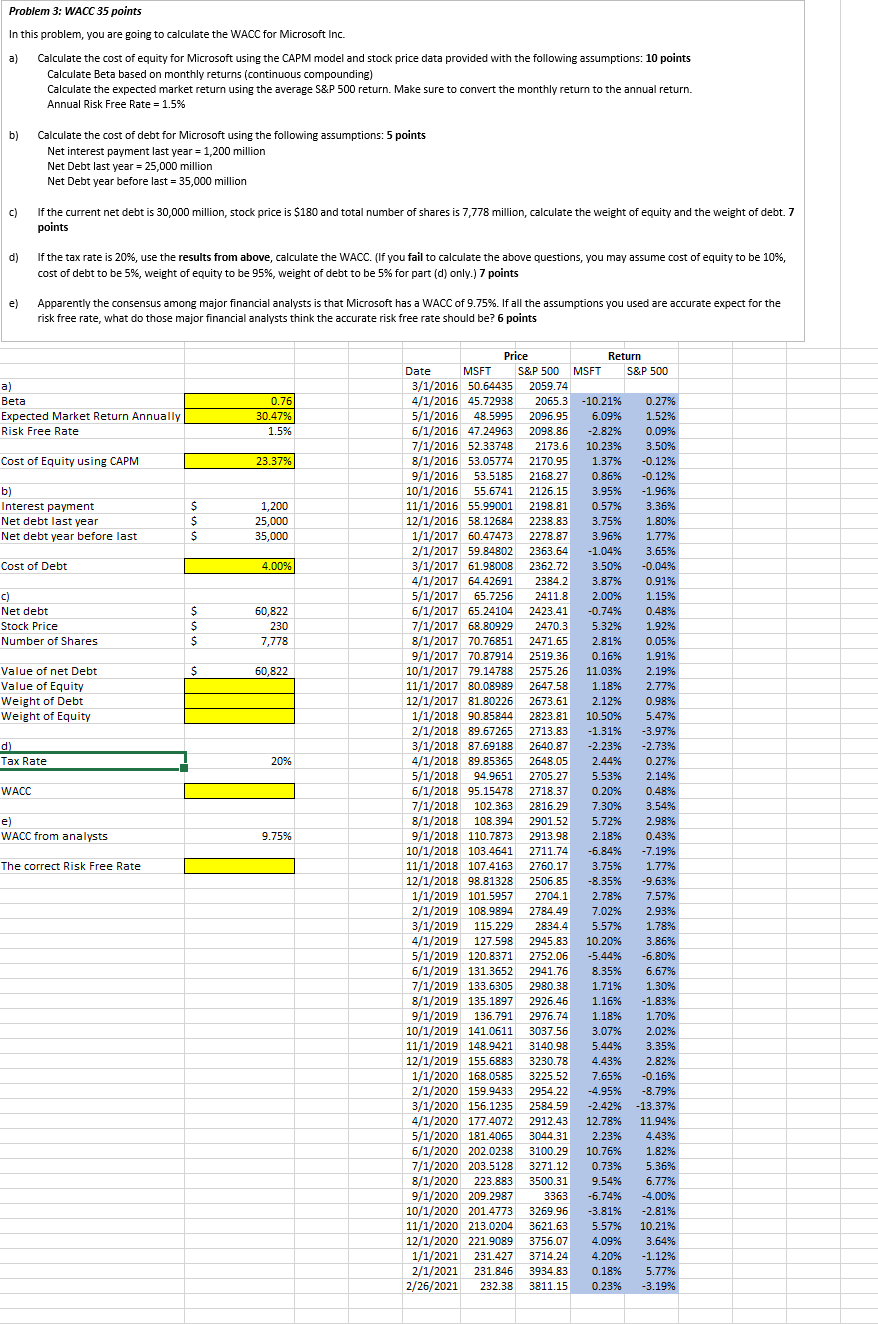
Problem 3: WACC 35 points In this problem, you are going to calculate the WACC for Microsoft Inc. a) Calculate the cost of equity for Microsoft using the CAPM model and stock price data provided with the following assumptions: 10 points Calculate Beta based on monthly returns (continuous compounding) Calculate the expected market return using the average S&P 500 return. Make sure to convert the monthly return to the annual return. Annual Risk Free Rate = 1.5% b) Calculate the cost of debt for Microsoft using the following assumptions: 5 points Net interest payment last year = 1,200 million Net Debt last year = 25,000 million Net Debt year before last = 35,000 million If the current net debt is 30,000 million, stock price is $180 and total number of shares is 7,778 million, calculate the weight of equity and the weight of debt. 7 points d) If the tax rate is 20%, use the results from above, calculate the WACC. (If you fail to calculate the above questions, you may assume cost of equity to be 10%, cost of debt to be 5%, weight of equity to be 95%, weight of debt to be 5% for part (d) only.) 7 points Apparently the consensus among major financial analysts is that Microsoft has a WACC of 9.75%. If all the assumptions you used are accurate expect for the risk free rate, what do those major financial analysts think the accurate risk free rate should be? 6 points e) a) Beta Expected Market Return Annually Risk Free Rate 0.76 30.47% 1.5% Cost of Equity using CAPM 23.37% b) Interest payment Net debt last year Net debt year before last $ $ $ 1,200 25,000 35,000 Cost of Debt 4.00% c) Net debt Stock Price Number of Shares $ $ $ 60,822 230 7,778 S 60,822 Value of net Debt Value of Equity Weight of Debt Weight of Equity d) Tax Rate 20% WACC 2816.29 e) WACC from analysts Price Return Date MSFT S&P 500 MSFT S&P 500 3/1/2016 50.64435 2059.74 4/1/2016 45.72938 2065.3 - 10.21% 0.27% 5/1/2016 48.5995 2096.95 6.09% 1.52% 6/1/2016 47.24963 2098.86 -2.82% 0.09% 7/1/2016 52.33748 2173.6 10.23% 3.50% 8/1/2016 53.05774 2170.95 1.37% -0.12% 9/1/2016 53.5185 2168.27 0.86% -0.12% 10/1/2016 55.6741 2126.15 3.95% -1.96% 11/1/2016 55.99001 2198.81 0.57% 3.36% 12/1/2016 58.12684 2238.83 3.75% 1.80% 1/1/2017 60.47473 2278.87 3.96% 1.77% 2/1/2017 59.84802 2363.64 -1.04% 3.65% 3/1/2017 61.98008 2362.72 3.50% -0.04% 4/1/2017 64.42691 2384.2 3.87% 0.91% 5/1/2017 65.7256 2411.8 2.00% 1.15% 6/1/2017 65.24104 2423.41 -0.74% 0.48% 7/1/2017 68.80929 2470.3 5.32% 1.92% 8/1/2017 70.76851 2471.65 2.81% 0.05% 9/1/2017 70.87914 2519.36 0.16% 1.91% 10/1/2017 79.14788 2575.26 11.03% 2.19% 11/1/2017 80.08989 2647.58 1.18% 2.77% 12/1/2017 81.80226 2673.61 2.12% 0.98% 1/1/2018 90.85844 2823.81 10.50% 5.47% 2/1/2018 89.67265 2713.83 -1.31% -3.97% 3/1/2018 87.69188 2640.87 -2.23% -2.73% 4/1/2018 89.85365 2648.05 2.44% 0.27% 5/1/2018 94.9651 2705.27 5.53% 2.14% 6/1/2018 95.15478 2718.37 0.20% 0.48% 7/1/2018 102.363 7.30% 3.54% 8/1/2018 108.394 2901.52 5.72% 2.98% 9/1/2018 110.7873 2913.98 2.18% 0.43% 10/1/2018 103.4641 2711.74 -6.84% -7.19% 11/1/2018 107.4163 2760.17 3.75% 1.77% 12/1/2018 98.81328 2506.85 -8.35% -9.63% 1/1/2019 101.5957 2704.1 2.78% 7.57% 2/1/2019 108.9894 2784.49 7.02% 2.93% 3/1/2019 115.229 2834.4 5.57% 1.78% 4/1/2019 127.598 2945.83 10.20% 3.86% 5/1/2019 120.8371 2752.06 -5.44% -6.80% 6/1/2019 131.3652 2941.76 8.35% 6.67% 7/1/2019 133.6305 2980.38 1.71% 1.30% 8/1/2019 135.1897 2926.46 1.16% -1.83% 9/1/2019 136.791 2976.74 1.18% 1.70% 10/1/2019 141.0611 3037.56 3.07% 2.02% 11/1/2019 148.9421 3140.98 5.44% 3.35% 12/1/2019 155.6883 3230.78 4.43% 2.82% 1/1/2020 168.0585 3225.52 7.65% -0.16% 2/1/2020 159.9433 2954.22 -4.95% -8.79% 3/1/2020 156.1235 2584.59 -2.42% -13.37% 4/1/2020 177.4072 2912.43 12.78% 11.94% 5/1/2020 181.4065 3044.31 2.23% 4.43% 6/1/2020 202.0238 3100.29 10.76% 1.82% 7/1/2020 203.5128 3271.12 0.73% 5.36% 8/1/2020 223.883 3500.31 9.54% 6.77% 9/1/2020 209.2987 3363 -6.74% -4.00% 10/1/2020 201.4773 3269.96 -3.81% -2.81% 11/1/2020 213.0204 3621.65 5.57% 10.21% 12/1/2020 221.9089 3756.07 4.09% 3.64% 1/1/2021 231.427 3714.24 4.20% -1.12% 2/1/2021 231.846 3934.83 0.18% 5.77% 2/26/2021 232.38 3811.15 0.23% -3.19% 9.75% The correct Risk Free Rate Problem 3: WACC 35 points In this problem, you are going to calculate the WACC for Microsoft Inc. a) Calculate the cost of equity for Microsoft using the CAPM model and stock price data provided with the following assumptions: 10 points Calculate Beta based on monthly returns (continuous compounding) Calculate the expected market return using the average S&P 500 return. Make sure to convert the monthly return to the annual return. Annual Risk Free Rate = 1.5% b) Calculate the cost of debt for Microsoft using the following assumptions: 5 points Net interest payment last year = 1,200 million Net Debt last year = 25,000 million Net Debt year before last = 35,000 million If the current net debt is 30,000 million, stock price is $180 and total number of shares is 7,778 million, calculate the weight of equity and the weight of debt. 7 points d) If the tax rate is 20%, use the results from above, calculate the WACC. (If you fail to calculate the above questions, you may assume cost of equity to be 10%, cost of debt to be 5%, weight of equity to be 95%, weight of debt to be 5% for part (d) only.) 7 points Apparently the consensus among major financial analysts is that Microsoft has a WACC of 9.75%. If all the assumptions you used are accurate expect for the risk free rate, what do those major financial analysts think the accurate risk free rate should be? 6 points e) a) Beta Expected Market Return Annually Risk Free Rate 0.76 30.47% 1.5% Cost of Equity using CAPM 23.37% b) Interest payment Net debt last year Net debt year before last $ $ $ 1,200 25,000 35,000 Cost of Debt 4.00% c) Net debt Stock Price Number of Shares $ $ $ 60,822 230 7,778 S 60,822 Value of net Debt Value of Equity Weight of Debt Weight of Equity d) Tax Rate 20% WACC 2816.29 e) WACC from analysts Price Return Date MSFT S&P 500 MSFT S&P 500 3/1/2016 50.64435 2059.74 4/1/2016 45.72938 2065.3 - 10.21% 0.27% 5/1/2016 48.5995 2096.95 6.09% 1.52% 6/1/2016 47.24963 2098.86 -2.82% 0.09% 7/1/2016 52.33748 2173.6 10.23% 3.50% 8/1/2016 53.05774 2170.95 1.37% -0.12% 9/1/2016 53.5185 2168.27 0.86% -0.12% 10/1/2016 55.6741 2126.15 3.95% -1.96% 11/1/2016 55.99001 2198.81 0.57% 3.36% 12/1/2016 58.12684 2238.83 3.75% 1.80% 1/1/2017 60.47473 2278.87 3.96% 1.77% 2/1/2017 59.84802 2363.64 -1.04% 3.65% 3/1/2017 61.98008 2362.72 3.50% -0.04% 4/1/2017 64.42691 2384.2 3.87% 0.91% 5/1/2017 65.7256 2411.8 2.00% 1.15% 6/1/2017 65.24104 2423.41 -0.74% 0.48% 7/1/2017 68.80929 2470.3 5.32% 1.92% 8/1/2017 70.76851 2471.65 2.81% 0.05% 9/1/2017 70.87914 2519.36 0.16% 1.91% 10/1/2017 79.14788 2575.26 11.03% 2.19% 11/1/2017 80.08989 2647.58 1.18% 2.77% 12/1/2017 81.80226 2673.61 2.12% 0.98% 1/1/2018 90.85844 2823.81 10.50% 5.47% 2/1/2018 89.67265 2713.83 -1.31% -3.97% 3/1/2018 87.69188 2640.87 -2.23% -2.73% 4/1/2018 89.85365 2648.05 2.44% 0.27% 5/1/2018 94.9651 2705.27 5.53% 2.14% 6/1/2018 95.15478 2718.37 0.20% 0.48% 7/1/2018 102.363 7.30% 3.54% 8/1/2018 108.394 2901.52 5.72% 2.98% 9/1/2018 110.7873 2913.98 2.18% 0.43% 10/1/2018 103.4641 2711.74 -6.84% -7.19% 11/1/2018 107.4163 2760.17 3.75% 1.77% 12/1/2018 98.81328 2506.85 -8.35% -9.63% 1/1/2019 101.5957 2704.1 2.78% 7.57% 2/1/2019 108.9894 2784.49 7.02% 2.93% 3/1/2019 115.229 2834.4 5.57% 1.78% 4/1/2019 127.598 2945.83 10.20% 3.86% 5/1/2019 120.8371 2752.06 -5.44% -6.80% 6/1/2019 131.3652 2941.76 8.35% 6.67% 7/1/2019 133.6305 2980.38 1.71% 1.30% 8/1/2019 135.1897 2926.46 1.16% -1.83% 9/1/2019 136.791 2976.74 1.18% 1.70% 10/1/2019 141.0611 3037.56 3.07% 2.02% 11/1/2019 148.9421 3140.98 5.44% 3.35% 12/1/2019 155.6883 3230.78 4.43% 2.82% 1/1/2020 168.0585 3225.52 7.65% -0.16% 2/1/2020 159.9433 2954.22 -4.95% -8.79% 3/1/2020 156.1235 2584.59 -2.42% -13.37% 4/1/2020 177.4072 2912.43 12.78% 11.94% 5/1/2020 181.4065 3044.31 2.23% 4.43% 6/1/2020 202.0238 3100.29 10.76% 1.82% 7/1/2020 203.5128 3271.12 0.73% 5.36% 8/1/2020 223.883 3500.31 9.54% 6.77% 9/1/2020 209.2987 3363 -6.74% -4.00% 10/1/2020 201.4773 3269.96 -3.81% -2.81% 11/1/2020 213.0204 3621.65 5.57% 10.21% 12/1/2020 221.9089 3756.07 4.09% 3.64% 1/1/2021 231.427 3714.24 4.20% -1.12% 2/1/2021 231.846 3934.83 0.18% 5.77% 2/26/2021 232.38 3811.15 0.23% -3.19% 9.75% The correct Risk Free Rate