

Comprehensive Ratio Analysis The Jimenez Corporation's forecasted 2017 financial statements follow, along with some industry average ratios. Jimenez Corporation: Forecasted Balance Sheet as of December
Comprehensive Ratio Analysis
The Jimenez Corporation's forecasted 2017 financial statements follow, along with some industry average ratios.
Jimenez Corporation: Forecasted Balance Sheet as of December 31, 2017
Assets Cash $ 72,000
Accounts receivable 439,000
Inventories 894,000
Total current assets $1,405,000 Fixed assets 431,000 Total assets $1,836,000 Liabilities and Equity Accounts payable $ 332,000 Notes payable 100,000 Accruals 170,000 Total current liabilities $ 602,000 Long-term debt 404,290 Common stock 575,000 Retained earnings 254,710 Total liabilities and equity $1,836,000
Jimenez Corporation: Forecasted Income Statement for 2017
Sales $4,290,000 Cost of goods sold 3,580,000 Selling, general, and administrative expenses 370,320 Depreciation and amortization 159,000 Earnings before taxes (EBT) $ 180,680 Taxes (40%) 72,272 Net income $ 108,408
Jimenez Corporation: Per Share Data for 2017
EPS $ 4.71 Cash dividends per share $ 0.95 P/E ratio 5.0 Market price (average) $ 23.57 Number of shares outstanding 23,000
Industry Ratios
Quick ratio 1.0 Current ratio 2.7 Inventory turnover** 7.0 Days sales outstanding*** 32.0 days Fixed assets turn over** 13.0 Total assets turnover** 2.6 Return on assets 9.1% Return on equity 18.2% Profit margin on sales 3.5% Debt-to-assets ratio 21.0% Liabilities-to-assets ratio 50.0% P/E ratio 6.0 Price/Cash flow ratio 3.5 Market/Book ratio 3.5
**Based on year-end balance sheet figures.
***Calculation is based on a 365-day year.
Calculate Jimenez's 2017 forecasted ratios, compare them with the industry average data, and comment briefly on Jimenez's projected strengths and weaknesses. Assume that there are no changes from the prior period to any of the operating balance sheet accounts. Round DSO to the nearest whole number. Round the other ratios to one decimal place.
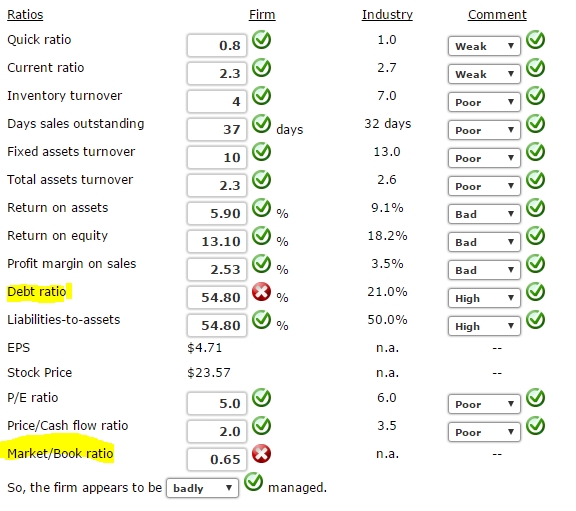
Ratios Firm Industry Comment Quick ratio 1.0 0.8 Weak Current ratio 2.7 2.3 Weak Inventory turnover 7.0 4 Poor Days sales outstanding 32 days 37 days Poor Fixed assets turnover 13.0 10 Poor Total assets turnover 2.6 2.3 Poor Return on assets 5.90 % 9.1% Bad Return on equity 18.2% 13.10 % Bad Profit margin on sales 3.5% 2.53 % Bad Debt ratio 21.0% 54.80 % High Liabilities-to-assets 50.0% 54.80 % High EPS $4.71 n.a. Stock Price $23.57 n.a. P/E ratio 6.0 5.0 Poor Price/Cash flow ratio 3.5 2.0 Poor Market/Book ratio n.a. 0.65 So, the firm appears to be badly managed.
Step by Step Solution
There are 3 Steps involved in it
Step: 1
To analyze Jimenez Corporations performance we calculate the following financial ratios based on the provided data and compare them to industry averages Heres a breakdown of each ratio calculation 1 Q...
See step-by-step solutions with expert insights and AI powered tools for academic success
Step: 2

Step: 3
Ace Your Homework with AI
Get the answers you need in no time with our AI-driven, step-by-step assistance
Get Started
Authors: Steven Berger
4th Edition
1118801687, 978-1118801680