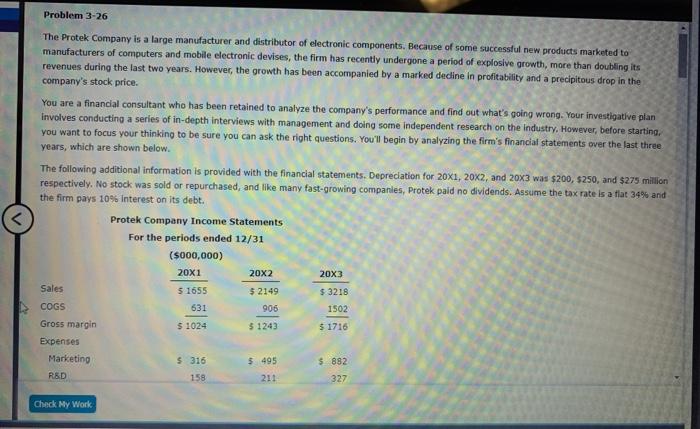
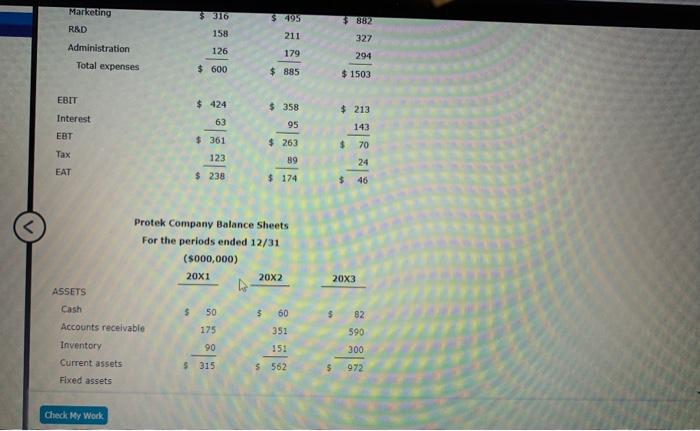
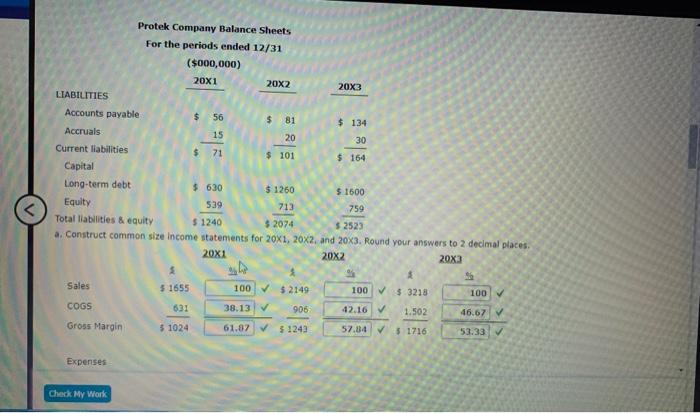
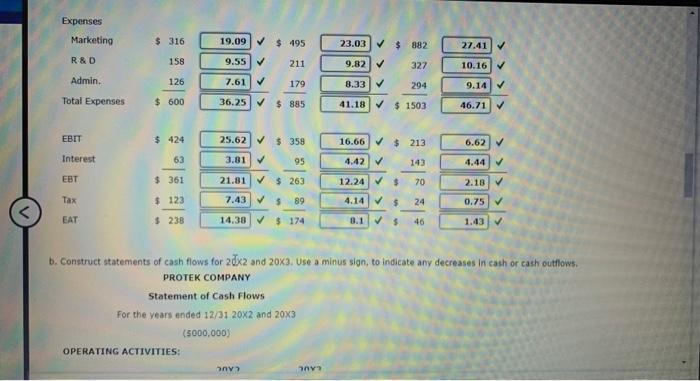
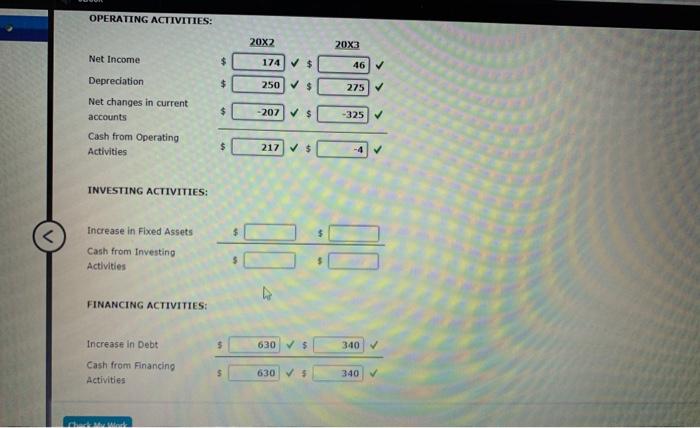
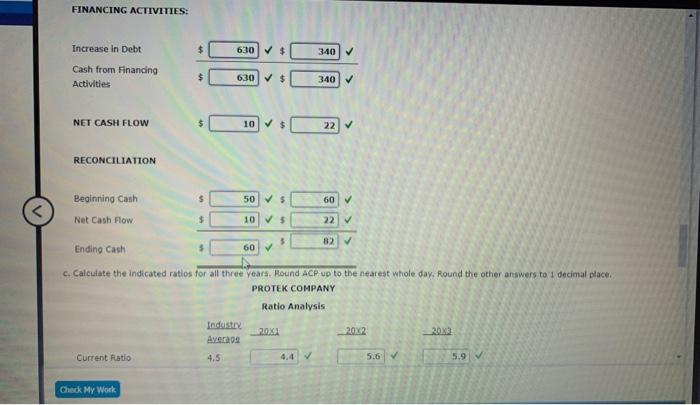
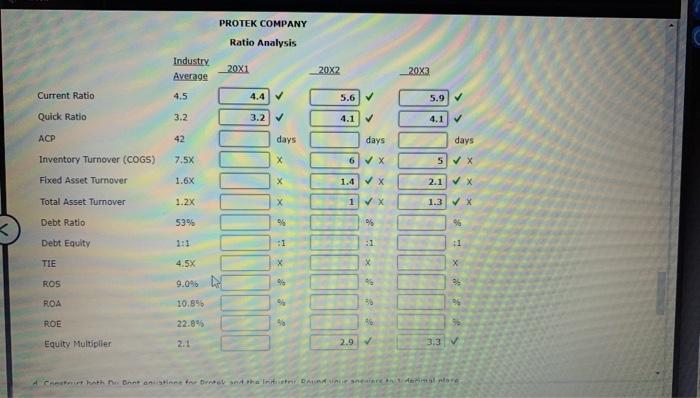
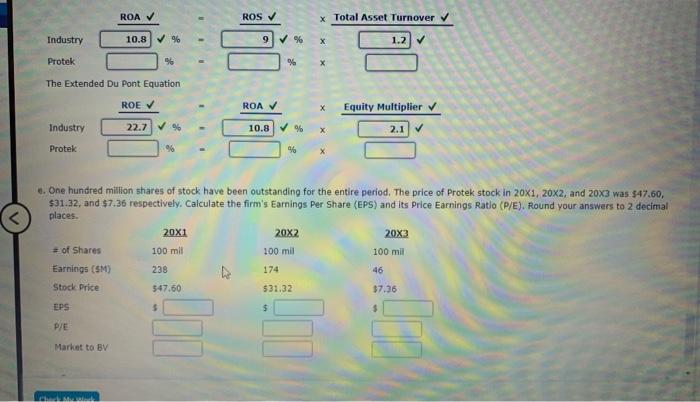
Problem 3-26 The Protek Company is a large manufacturer and distributor of electronic components. Because of some successful new products marketed to manufacturers of computers and mobile electronic devises, the firm has recently undergone a period of explosive growth, more than doubling its revenues during the last two years. However, the growth has been accompanied by a marked decline in profitability and a precipitous drop in the company's stock price. You are a financial consultant who has been retained to analyze the company's performance and find out what's going wrong. Your investigative plan involves conducting a series of in-depth interviews with management and doing some independent research on the industry. However, before starting you want to focus your thinking to be sure you can ask the right questions. You'll begin by analyzing the firm's financial statements over the last three years, which are shown below. The following additional information is provided with the financial statements. Depreciation for 20x1, 2012, and 20x3 was $200, $250, and $275 million respectively. No stock was sold or repurchased, and like many fast-growing companies, Protek paid no dividends. Assume the tax rate is a flat 34% and the firm pays 10% Interest on its debt. Protek Company Income Statements For the periods ended 12/31 ($000,000) 20x1 20X2 20X3 Sales $ 2149 COGS 905 Gross margin $ 1024 5 1243 $ 1716 Expenses Marketing $ 316 5495 $ 882 R&D 158 211 $ 1655 $ 3216 631 1502 327 Check My Work 3 316 $ 495 882 158 Marketing R&D Administration Total expenses 211 327 126 179 294 $ 600 $ 885 $ 1503 $ 358 EBIT Interest EBT $ 424 63 $ 213 143 95 $361 $ 263 Tax EAT $ 70 24 89 123 $ 238 $ 174 $ 46 L 20x3 Protek Company Balance Sheets For the periods ended 12/31 (5000,000) 20X1 20x2 ho ASSETS Cash $ 50 3 60 Accounts receivable 175 351 Inventory 90 15: Current assets $ 315 5562 Fixed assets 82 590 300 5 972 Check My Work Protek Company Balance Sheets For the periods ended 12/31 ($000,000) 20X1 20x2 20x3 LIABILITIES Accounts payable $ 56 $ 81 $ 134 Accruals 15 20 30 Current liabilities $ 71 $ 101 $ 164 Capital Long-term debt $ 630 $ 1260 $ 1600 Equilty 539 713 Total liabilities & equity $ 1240 $ 2074 $ 2523 a. Construct common site income statements for 20x1, 20x2 and 20x3. Round your answers to 2 decimal places 20x1 20X2 20x3 759 Sales 5 1655 100 $ 2149 100 5.3213 100 631 38.13 906 42.16 1.502 COGS Gross Margin 46.67 7 5 1024 61.07 5 1243 57.34 5 1716 53.33 Expenses Check My Work Expenses Marketing $ 316 19.09$ 495 23.03 $ 882 27.41 R&D 158 9.55 211 9.82 327 10.16 Admin. 126 7.61 179 8.33 294 9.14 Total Expenses $ 600 36.25 $ 885 41.18 $ 1503 46.71 EBIT $ 424 25.62 $ 359 16.66 $ 213 6.62 Interest 63 3.81 95 4.42 143 4.44 EBT $361 21.81 $ 263 12.24 $ 70 2.18 Tax $123 7.43 $ 89 4.14 5 24 0.75 EAT $ 238 14.38 $ 174 8.1 $ 46 1.43 b. Construct statements of cash flows for 20x2 and 20x2. Use a minus sign, to indicate any decreases in cash or cash outflows. PROTEK COMPANY Statement of Cash Flows For the years ended 12/31 2012 and 20x3 (5000,000) OPERATING ACTIVITIES: OPERATING ACTIVITIES: 20X2 20x3 Net Income 174 $ 46 Depreciation 250 $ 275 -207 $ -325 Net changes in current accounts Cash from Operating Activities 217 $ -4 INVESTING ACTIVITIES: Increase in Fixed Assets Cash from Investing Activities SC FINANCING ACTIVITIES: Increase in Debt 630 $ 340 Cash from Financing Activities 630 V5 3407 Checode FINANCING ACTIVITIES: $ 630$ 340 Increase in Debt Cash from Financing Activities $ 630 $ 340 NET CASH FLOW 10 $ 22 RECONCILIATION Beginning Cash $ 505 60 Net Cash Flow $ 105 22 82 Ending Cash 5 60 c. Calculate the indicated ratios for all three years. Round ACP up to the nearest whole day. Round the other answers to 1 decimal place PROTEK COMPANY Ratio Analysis Industry Average 202 20x2 20x3 Current Ratio 4.5 4.4 5.6 5.9 7 Check My Work PROTEK COMPANY Ratio Analysis Industry Average 20X1 20X2 20X3 Current Ratio 4.5 4.4 5.6 5.9 Quick Ratio 3.2 3.2 4.1 4.1 ACP 42 days days days Inventory Turnover (COGS) 7.5X X 6 X 5 X Fixed Asset Turnover 1.6X 1.4 X 2.1 x Total Asset Turnover 1.2X X 1 X 1.3 X Debt Ratio 53% 96 26 96 Debt Equity 1:1 21 1 1 TIE 4.5X X X ROS 9.0% ROA 10.89 36 95 ROE 22.89 3 Equity Multiplier 2.1 2.9 3.3 Cathath n Bantaniler for sthani Denetimore ROA ROS * Total Asset Turnover Industry 10.8 % 9 % X 1.2 Protek % 96 X The Extended Du Pont Equation ROE ROA X Equity Multiplier 22.7 % 10.8 % 2.1 Industry Protek 96 % One hundred million shares of stock have been outstanding for the entire period. The price of Protek stock in 20x1, 20x2, and 20x3 was $47.60, $31.32, and $7.36 respectively. Calculate the firm's Earnings Per Share (EPS) and its Price Earnings Ratio (P/E). Round your answers to 2 decimal places. 20X1 20x2 20x3 =of Shares 100 mil 100 mil Earnings (SM) 238 Stock Price 547.60 $31.32 100 mil 174 46 $7.36 EPS 5 $ P/E Market to BV