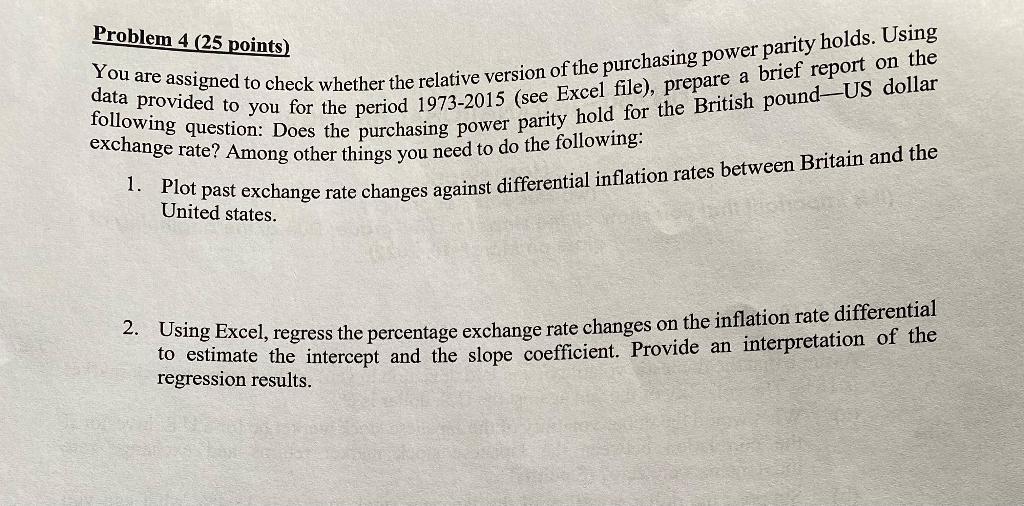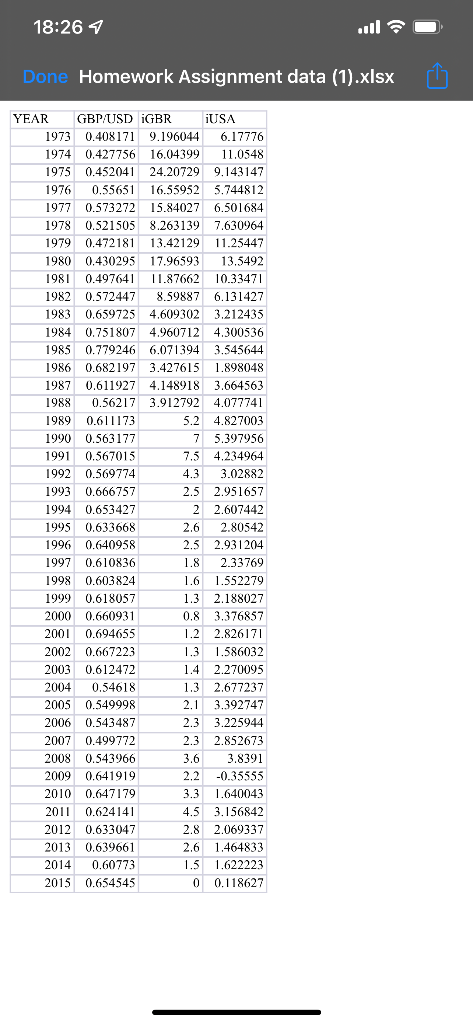

Problem 4 (25 points) You are assigned to check whether the relative version of the purchasing power parity holds. Using data provided to you for the period 1973-2015 (see Excel file), prepare a brief report on the following question: Does the purchasing power parity hold for the British pound-US dollar exchange rate? Among other things you need to do the following: 1. Plot past exchange rate changes against differential inflation rates between Britain and the United states. 2. Using Excel, regress the percentage exchange rate changes on the inflation rate differential to estimate the intercept and the slope coefficient. Provide an interpretation of the regression results. 18:26 1 ll5 Done Homework Assignment data (1).xlsx YEAR GBP/USD GBR USA 1973 0.408171 9.196044 6.17776 1974 0.427756 16.04399 11.0548 1975 0.452041 24.20729 9.143147 1976 0.55651 16.55952 5.744812 1977 0.573272 15.84027 6.501684 1978 0.521505 8.263139 7.630964 1979 0.472181 13.42129 11.25447 1980 0.430295 17.96593 13.5492 1981 0.497641 11.87662 10.33471 1982 0.572447 8.59887 6.131427 1983 0.659725 4.609302 3.212435 1984 0.751807 4.960712 4.300536 1985 0.779246 6.071394 3.545644 1986 0.682197 3.427615 1.898048 1987 0.611927 4.148918 3.664563 1988 0.56217 3.912792 4.077741 1989 0.611173 5.2 4.827003 1990 0.563177 7 5.397956 1991 0.567015 7.5 4.234964 1992 0.569774 4.3 3.02882 1993 0.666757 2.5 2.951657 1994 0.653427 2 2 2.607442 1995 0.633668 2.6 2.80542 1996 0.640958 2.5 2.931204 1997 0.610836 1.8 2.33769 1998 0.603824 1.6 1.552279 1999 0.618057 1.3 2.188027 2000 0.660931 0.8 3.376857 2001 0.694655 1.2 2.826171 2002 0.667223 1.3 1.586032 2003 0.612472 1.4 2.270095 2004 0.54618 1.3 2.677237 2005 0.549998 2.1 3.392747 2006 0.543487 2.3 3.225944 2007 0.499772 2.3 2.852673 2008 0.543966 3.6 3.8391 2009 0.641919 2.2 -0.35555 2010 0.647179 3.3 1.640043 2011 0.624141 4.5 3.156842 2012 0.633047 2.8 2.069337 2013 0.639661 2.6 1.464833 2014 0.60773 1.5 1.622223 2015 0.654545 0 0 0.118627 Problem 4 (25 points) You are assigned to check whether the relative version of the purchasing power parity holds. Using data provided to you for the period 1973-2015 (see Excel file), prepare a brief report on the following question: Does the purchasing power parity hold for the British pound-US dollar exchange rate? Among other things you need to do the following: 1. Plot past exchange rate changes against differential inflation rates between Britain and the United states. 2. Using Excel, regress the percentage exchange rate changes on the inflation rate differential to estimate the intercept and the slope coefficient. Provide an interpretation of the regression results. 18:26 1 ll5 Done Homework Assignment data (1).xlsx YEAR GBP/USD GBR USA 1973 0.408171 9.196044 6.17776 1974 0.427756 16.04399 11.0548 1975 0.452041 24.20729 9.143147 1976 0.55651 16.55952 5.744812 1977 0.573272 15.84027 6.501684 1978 0.521505 8.263139 7.630964 1979 0.472181 13.42129 11.25447 1980 0.430295 17.96593 13.5492 1981 0.497641 11.87662 10.33471 1982 0.572447 8.59887 6.131427 1983 0.659725 4.609302 3.212435 1984 0.751807 4.960712 4.300536 1985 0.779246 6.071394 3.545644 1986 0.682197 3.427615 1.898048 1987 0.611927 4.148918 3.664563 1988 0.56217 3.912792 4.077741 1989 0.611173 5.2 4.827003 1990 0.563177 7 5.397956 1991 0.567015 7.5 4.234964 1992 0.569774 4.3 3.02882 1993 0.666757 2.5 2.951657 1994 0.653427 2 2 2.607442 1995 0.633668 2.6 2.80542 1996 0.640958 2.5 2.931204 1997 0.610836 1.8 2.33769 1998 0.603824 1.6 1.552279 1999 0.618057 1.3 2.188027 2000 0.660931 0.8 3.376857 2001 0.694655 1.2 2.826171 2002 0.667223 1.3 1.586032 2003 0.612472 1.4 2.270095 2004 0.54618 1.3 2.677237 2005 0.549998 2.1 3.392747 2006 0.543487 2.3 3.225944 2007 0.499772 2.3 2.852673 2008 0.543966 3.6 3.8391 2009 0.641919 2.2 -0.35555 2010 0.647179 3.3 1.640043 2011 0.624141 4.5 3.156842 2012 0.633047 2.8 2.069337 2013 0.639661 2.6 1.464833 2014 0.60773 1.5 1.622223 2015 0.654545 0 0 0.118627


