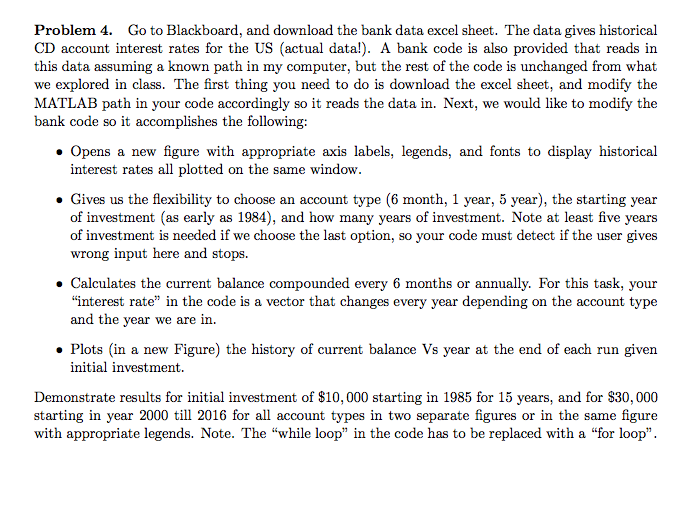
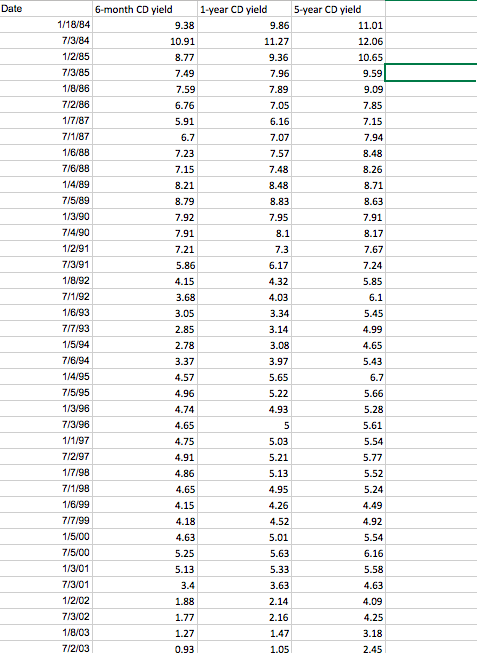
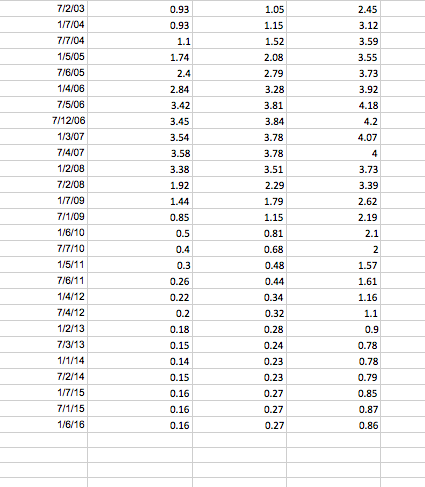
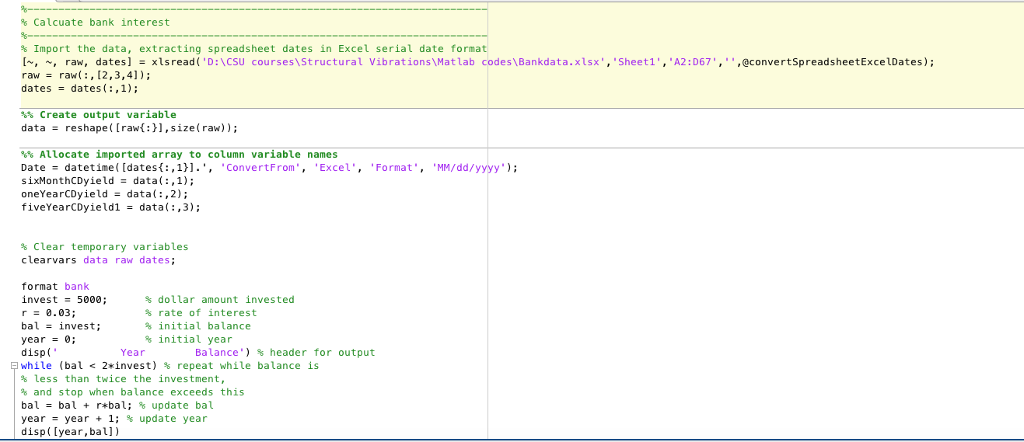
Problem 4. Go to Blackboard, and download the bank data excel sheet. The data gives historical CD account interest rates for the US (actual data!). A bank code is also provided that reads in this data assuming a known path in my computer, but the rest of the code is unchanged from what we explored in class. The first thing you need to do is download the excel sheet, and modify the MATLAB path in your code accordingly so it reads the data in. Next, we would like to modify the bank code so it accomplishes the following: Opens a new figure with appropriate axis labels, legends, and fonts to display historical interest rates all plotted on the same window. Gives us the flexibility to choose an account type (6 month, 1 year, 5 year), the starting year of investment (as early as 1984), and how many years of investment. Note at least five years of investment is needed if we choose the last option, so your code must detect if the user gives wrong input here and stops. Calculates the current balance compounded every 6 months or annually. For this task, your "interest rate" in the code is a vector that changes every year depending on the account type and the year we are in Plots (in a new Figure) the history of current balance Vs year at the end of each run given initial investment. Demonstrate results for initial investment of $10,000 starting in 1985 for 15 years, and for $30,000 starting in year 2000 till 2016 for all account types in two separate figures or in the same figure with appropriate legends. Note. The "while loop" in the code has to be replaced with a "for loop" Problem 4. Go to Blackboard, and download the bank data excel sheet. The data gives historical CD account interest rates for the US (actual data!). A bank code is also provided that reads in this data assuming a known path in my computer, but the rest of the code is unchanged from what we explored in class. The first thing you need to do is download the excel sheet, and modify the MATLAB path in your code accordingly so it reads the data in. Next, we would like to modify the bank code so it accomplishes the following: Opens a new figure with appropriate axis labels, legends, and fonts to display historical interest rates all plotted on the same window. Gives us the flexibility to choose an account type (6 month, 1 year, 5 year), the starting year of investment (as early as 1984), and how many years of investment. Note at least five years of investment is needed if we choose the last option, so your code must detect if the user gives wrong input here and stops. Calculates the current balance compounded every 6 months or annually. For this task, your "interest rate" in the code is a vector that changes every year depending on the account type and the year we are in Plots (in a new Figure) the history of current balance Vs year at the end of each run given initial investment. Demonstrate results for initial investment of $10,000 starting in 1985 for 15 years, and for $30,000 starting in year 2000 till 2016 for all account types in two separate figures or in the same figure with appropriate legends. Note. The "while loop" in the code has to be replaced with a "for loop


