

Answered step by step
Verified Expert Solution
Question
1 Approved Answer
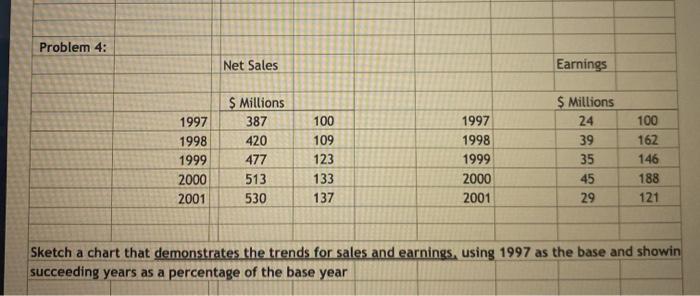
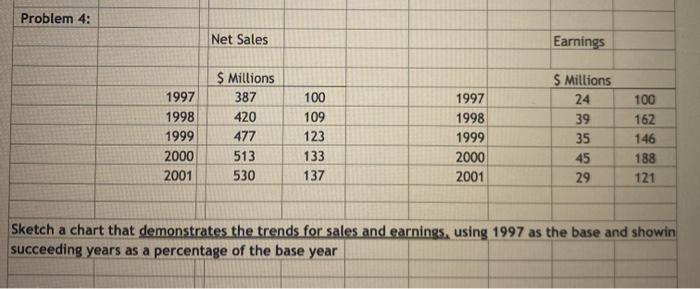
Problem 4: Net Sales Earnings 1997 1998 1999 2000 2001 $ Millions 387 420 477 513 530 100 109 123 133 137 1997 1998 1999
Step by Step Solution
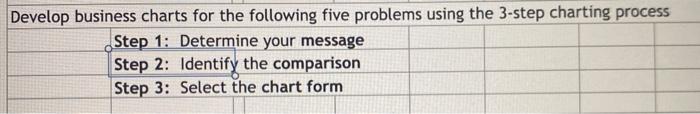
There are 3 Steps involved in it
Step: 1

Get Instant Access to Expert-Tailored Solutions
See step-by-step solutions with expert insights and AI powered tools for academic success
Step: 2

Step: 3
Ace Your Homework with AI
Get the answers you need in no time with our AI-driven, step-by-step assistance
Get Started
NHS Audit Committee Handbook Practical Guides
Authors: Governance And Audit Committee
3rd Edition
1904624839, 978-1904624837