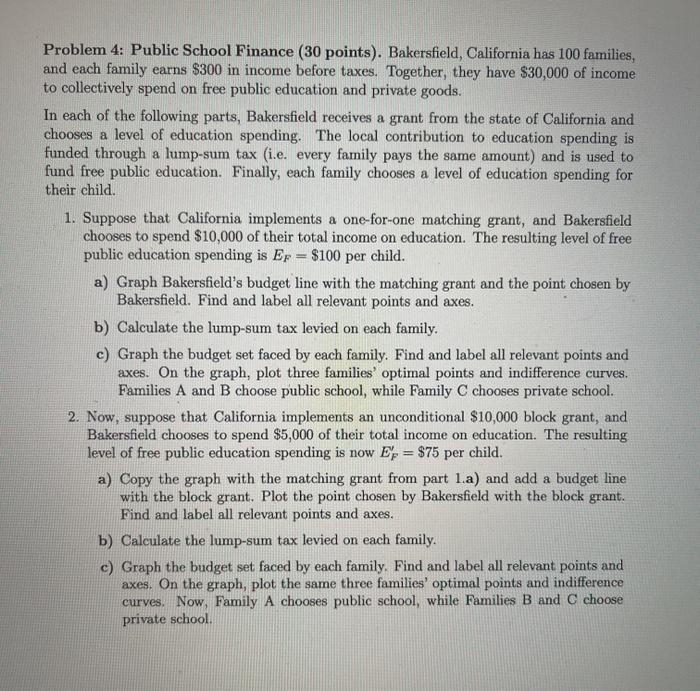
Problem 4: Public School Finance (30 points). Bakersfield, California has 100 families, and each family earns $300 in income before taxes. Together, they have $30,000 of income to collectively spend on free public education and private goods. In each of the following parts, Bakersfield receives a grant from the state of California and chooses a level of education spending. The local contribution to education spending is funded through a lump-sum tax (i.e. every family pays the same amount) and is used to fund free public education. Finally, each family chooses a level of education spending for their child. 1. Suppose that California implements a one-for-one matching grant, and Bakersfield chooses to spend $10,000 of their total income on education. The resulting level of free public education spending is Ep = $100 per child. a) Graph Bakersfield's budget line with the matching grant and the point chosen by Bakersfield. Find and label all relevant points and axes. b) Calculate the lump-sum tax levied on each family. c) Graph the budget set faced by each family. Find and label all relevant points and axes. On the graph, plot three families' optimal points and indifference curves. Families A and B choose public school, while Family C chooses private school. 2. Now, suppose that California implements an unconditional $10,000 block grant, and Bakersfield chooses to spend $5,000 of their total income on education. The resulting level of free public education spending is now Ep = $75 per child. a) Copy the graph with the matching grant from part 1.a) and add a budget line with the block grant. Plot the point chosen by Bakersfield with the block grant. Find and label all relevant points and axes. b) Calculate the lump-sum tax levied on each family. c) Graph the budget set faced by each family. Find and label all relevant points and axes. On the graph, plot the same three families' optimal points and indifference curves. Now, Family A chooses public school, while Families B and C choose private school. Problem 4: Public School Finance (30 points). Bakersfield, California has 100 families, and each family earns $300 in income before taxes. Together, they have $30,000 of income to collectively spend on free public education and private goods. In each of the following parts, Bakersfield receives a grant from the state of California and chooses a level of education spending. The local contribution to education spending is funded through a lump-sum tax (i.e. every family pays the same amount) and is used to fund free public education. Finally, each family chooses a level of education spending for their child. 1. Suppose that California implements a one-for-one matching grant, and Bakersfield chooses to spend $10,000 of their total income on education. The resulting level of free public education spending is Ep = $100 per child. a) Graph Bakersfield's budget line with the matching grant and the point chosen by Bakersfield. Find and label all relevant points and axes. b) Calculate the lump-sum tax levied on each family. c) Graph the budget set faced by each family. Find and label all relevant points and axes. On the graph, plot three families' optimal points and indifference curves. Families A and B choose public school, while Family C chooses private school. 2. Now, suppose that California implements an unconditional $10,000 block grant, and Bakersfield chooses to spend $5,000 of their total income on education. The resulting level of free public education spending is now Ep = $75 per child. a) Copy the graph with the matching grant from part 1.a) and add a budget line with the block grant. Plot the point chosen by Bakersfield with the block grant. Find and label all relevant points and axes. b) Calculate the lump-sum tax levied on each family. c) Graph the budget set faced by each family. Find and label all relevant points and axes. On the graph, plot the same three families' optimal points and indifference curves. Now, Family A chooses public school, while Families B and C choose private school


