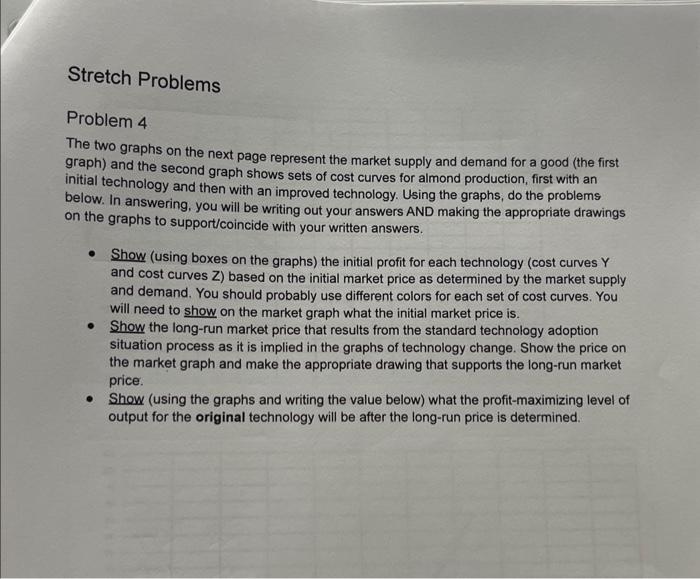
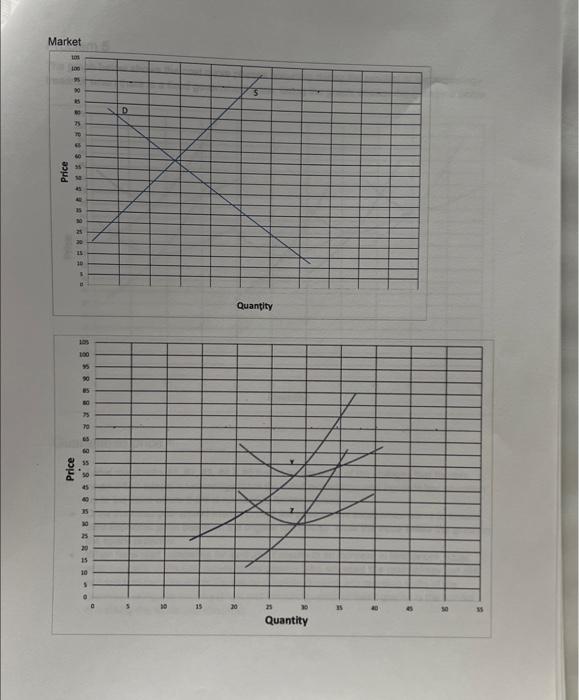
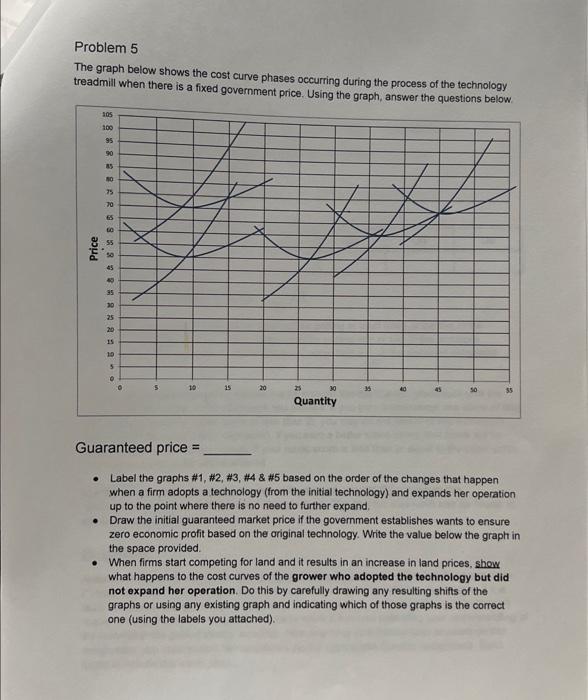
Problem 4 The two graphs on the next page represent the market supply and demand for a good (the first graph) and the second graph shows sets of cost curves for almond production, first with an initial technology and then with an improved technology. Using the graphs, do the problems below. In answering, you will be writing out your answers AND making the appropriate drawings on the graphs to support/coincide with your written answers. - Show (using boxes on the graphs) the initial profit for each technology (cost curves Y and cost curves Z) based on the initial market price as determined by the market supply and demand. You should probably use different colors for each set of cost curves. You will need to show on the market graph what the initial market price is. - Show the long-run market price that results from the standard technology adoption situation process as it is implied in the graphs of technology change. Show the price on the market graph and make the appropriate drawing that supports the long-run market price. - Show (using the graphs and writing the value below) what the profit-maximizing level of output for the original technology will be after the long-run price is determined. Problem 5 The graph below shows the cost curve phases occurring during the process of the technology treadmill when there is a fixed government price. Using the graph, answer the questions below. Guaranteed price = - Label the graphs #1,#2,#3,#4 based on the order of the changes that happen when a firm adopts a technology (from the initial technology) and expands her operation up to the point where there is no need to further expand. - Draw the initial guaranteed market price if the government establishes wants to ensure zero economic profit based on the original technology. Write the value below the graph in the space provided. - When firms start competing for land and it results in an increase in land prices, show what happens to the cost curves of the grower who adopted the teohnology but did not expand her operation. Do this by carefully drawing any resulting shifts of the graphs or using any existing graph and indicating which of those graphs is the correct one (using the labels you attached)


