Answered step by step
Verified Expert Solution
Link Copied!

Question

1 Approved Answer

Problem 4: Variables that may affect Grades The data set contains a random sample of STAT 250 Final Exam Scores out of 80 points. For
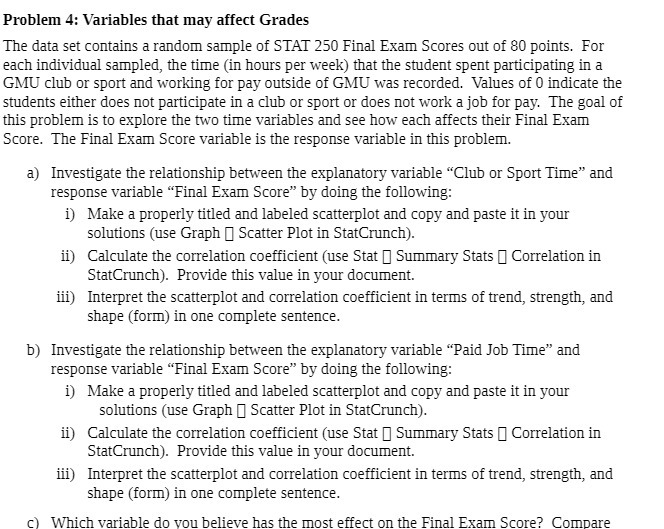
image text in transcribed
Problem 4: Variables that may affect Grades The data set contains a random sample of STAT 250 Final Exam Scores out of 80 points. For each individual sampled, the time (in hours per week) that the student spent participating in a GMU club or sport and working for pay outside of GMU was recorded. Values of 0 indicate the students either does not participate in a club or sport or does not work a job for pay. The goal of this problem is to explore the two time variables and see how each affects their Final Exam Score. The Final Exam Score variable is the response variable in this problem. a) Investigate the relationship between the explanatory variable "Club or Sport Time" and response variable "Final Exam Score" by doing the following: i) Make a properly titled and labeled scatterplot and copy and paste it in your solutions (use Graph [ Scatter Plot in StatCrunch). ii) Calculate the correlation coefficient (use Stat [ Summary Stats ] Correlation in StatCrunch). Provide this value in your document. iii) Interpret the scatterplot and correlation coefficient in terms of trend, strength, and shape (form) in one complete sentence. b) Investigate the relationship between the explanatory variable "Paid Job Time" and response variable "Final Exam Score" by doing the following: i) Make a properly titled and labeled scatterplot and copy and paste it in your solutions (use Graph Scatter Plot in StatCrunch). ii) Calculate the correlation coefficient (use Stat [ Summary Stats [ Correlation in StatCrunch). Provide this value in your document. iii) Interpret the scatterplot and correlation coefficient in terms of trend, strength, and shape (form) in one complete sentence. c) Which variable do you believe has the most effect on the Final Exam Score? Compare

Step by Step Solution

There are 3 Steps involved in it

Step: 1

blur-text-image

Get Instant Access to Expert-Tailored Solutions

See step-by-step solutions with expert insights and AI powered tools for academic success

Step: 2

blur-text-image_2

Step: 3

blur-text-image_3

Ace Your Homework with AI

Get the answers you need in no time with our AI-driven, step-by-step assistance

Get Started

Recommended Textbook for

Introduction to Probability

Authors: Mark Daniel Ward, Ellen Gundlach

1st edition

716771098, 978-1319060893, 1319060897, 978-0716771098

More Books

Students also viewed these Mathematics questions