Answered step by step
Verified Expert Solution
Question
1 Approved Answer
Problem 5 Use ggplot to create the data visualization below. The number of bins in the histogram should be set to 1 5 . ##
Problem
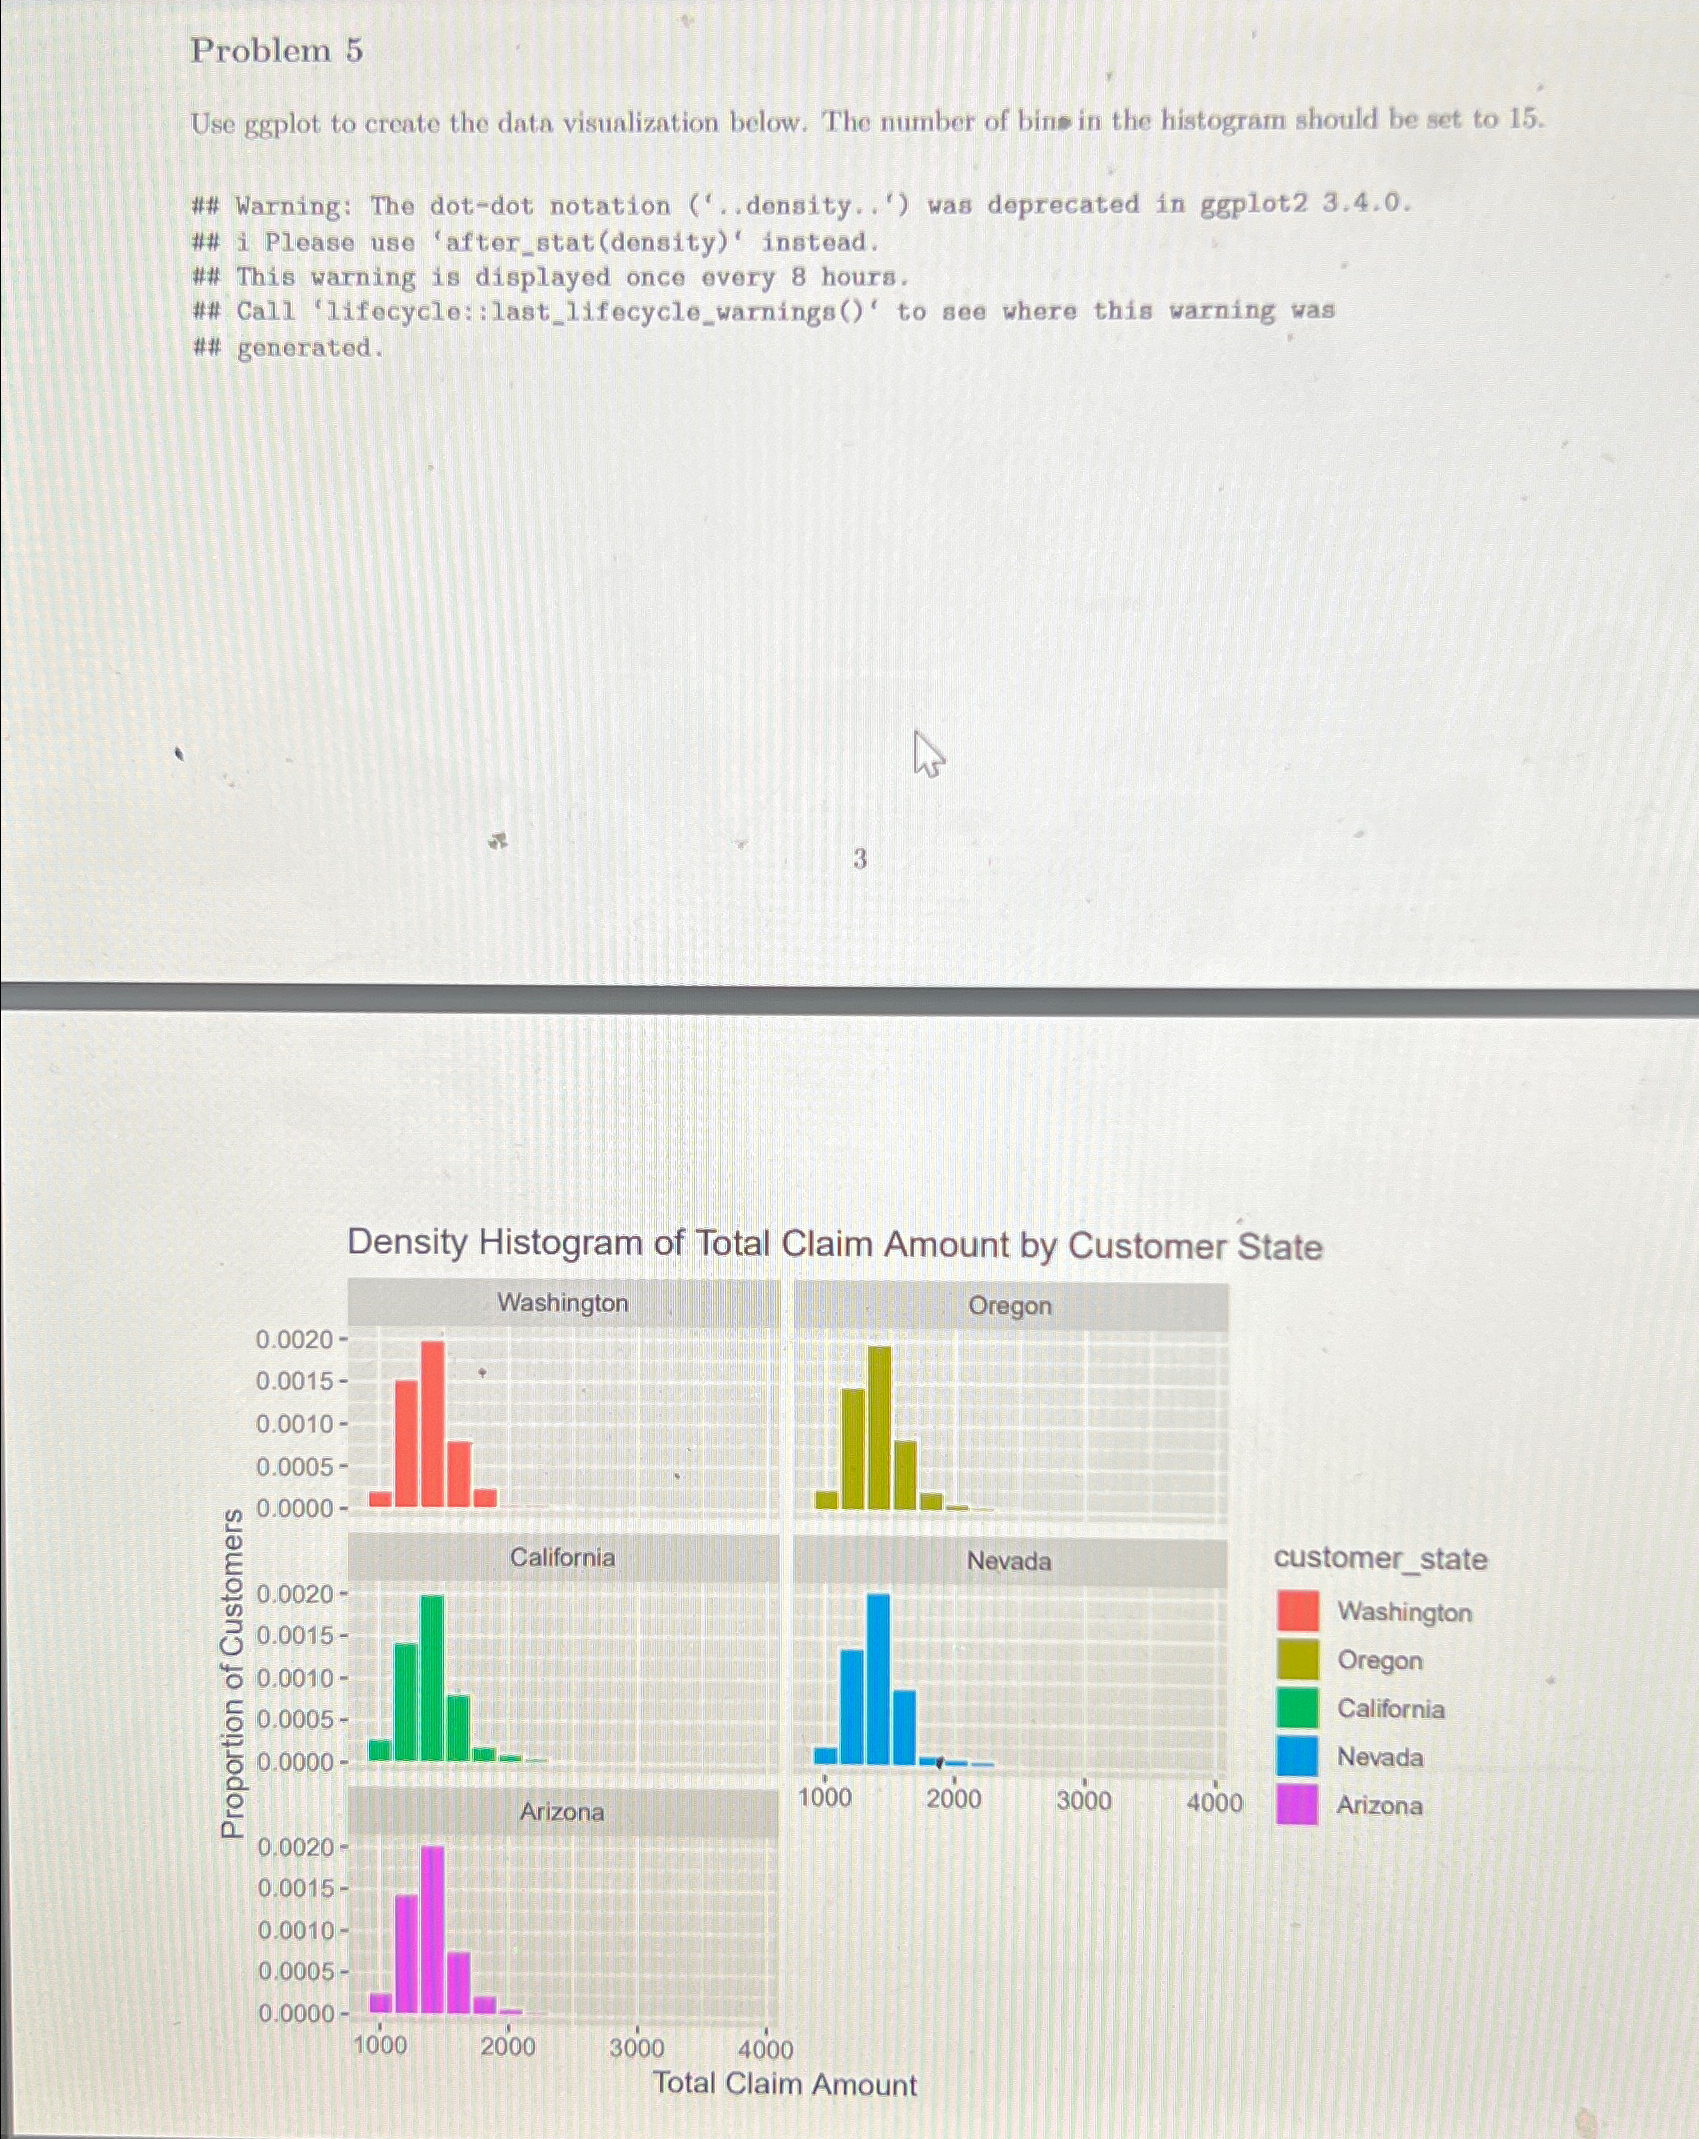
Use ggplot to create the data visualization below. The number of bins in the histogram should be set to
## Warning: The dotdot notation density.. was deprecated in ggplot
## i Please use 'afterstatdensity instead.
## This warning is displayed once every hours.
## Call 'lifecycle::lastlifecyclewarnings to see where this warning was ## generated.
Density Histogram of Total Claim Amount by Customer State
Step by Step Solution
There are 3 Steps involved in it
Step: 1

Get Instant Access to Expert-Tailored Solutions
See step-by-step solutions with expert insights and AI powered tools for academic success
Step: 2

Step: 3
Ace Your Homework with AI
Get the answers you need in no time with our AI-driven, step-by-step assistance
Get Started