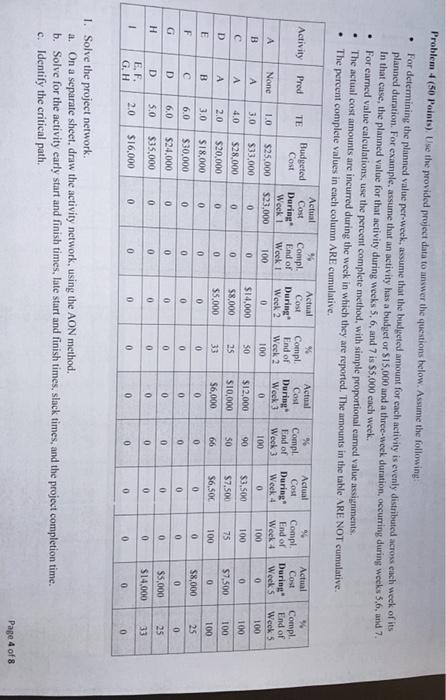
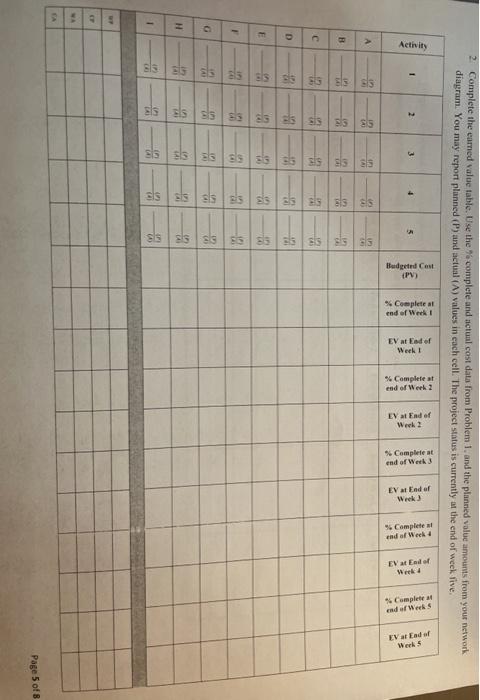
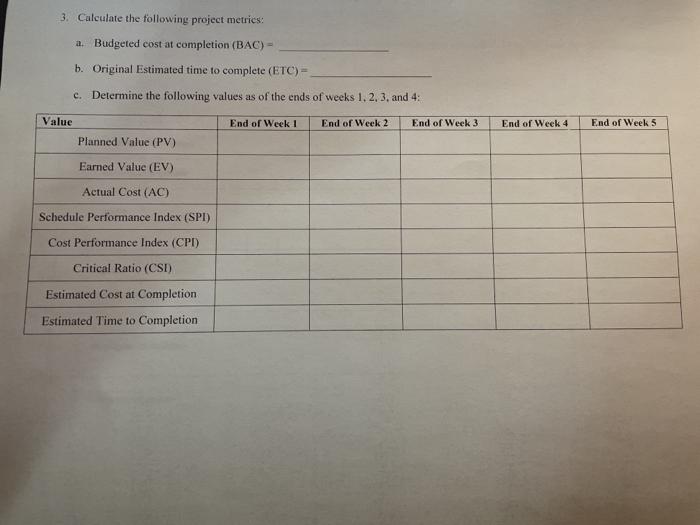
. Problem + (50 Points). Use the provided project data to answer the questions below. Assume the following: For determining the planned value per-week, assume that the budgeted amount for cach activity is evenly distributed across each week of its planned duration. For example, assume that an activity has a budget or $15,000 and a three-week duration, occurring during weeks 5,6, and 7 In that case, the planned value for that activity during weeks 5, 6, and 7 is $5.000 each week. For earned value calculations, use the percent complete method, with simple proportional cared value assignments The actual cost amounts are incurred during the week in which they are reported. The amounts in the table ARE NOT cumulative. The percent complete values in each column ARE cumulative. . . Activity Pred TE Budgeted Cost Actual Cost Actual Cost Daring Week 1 $23.000 0 % Compl. End of Week 1 100 % Compl. End of Week 2 100 76 Compl. End of Week 3 100 Actual Cost During Week 4 0 During A 1.0 None Weeks 0 Compl. End of Week 4 100 100 B 3.0 4.0 0 Actual Cost During Week 2 0 $14,000 58.000 $5,000 0 0 Actual Cost During Week 3 0 $12.000 $10,000 $6,000 0 D 0 0 50 25 90 50 Compl End of Week 5 100 100 100 100 25 $3.500 $7.500 $6.50C 75 0 $7,500 $25.000 $33,000 $28.000 $20,000 $18,000 $30,000 $24.000 $35,000 2.0 0 0 66 100 E 0 33 0 B 0 0 0 0 F 0 0 3.0 6.0 6.0 5.0 0 0 0 0 0 G D 0 o e o 0 0 0 $8,000 0 $5,000 $14,000 0 0 0 0 25 H 0 0 0 0 0 0 0 D EF. G H 33 1 2.0 $16,000 0 0 0 0 0 0 0 0 0 0 1. Solve the project network a. On a separate sheet. draw the activity network, using the AON method. b. Solve for the activity early start and finish times, late start and finish times, slack times, and the project completion time. c. Identify the critical path. Page 4 of 8 2. Complete the earned value table. Use the complete and actual cost data from Problem 1. and the planned value amounts from your network diagram. You may report planned (P) and actual (A) values in each cell. The project status is currently at the end of week five Activity 1 2 + 5 SS 53 Sis B sls sls C sis SIE els sis D * sls os sis 12 E 13 I sls als als sls sls sls 3 ss ss ss sls - G sls sls ss ss ss 53 ss 55 513 H 30 sls sls 1 SE Ds Page 5 of 8 3. Calculate the following project metrics: a. Budgeted cost at completion (BAC)- b. Original Estimated time to complete (ETC) - c. Determine the following values as of the ends of weeks 1. 2. 3. and 4: End of Week 1 End of Week 2 End of Week 3 End of Week 4 End of Week 5 Value Planned Value (PV) Earned Value (EV) Actual Cost (AC) Schedule Performance Index (SPI) Cost Performance Index (CPI) Critical Ratio (CSI) Estimated Cost at Completion Estimated Time to Completion 4. Use the provided template to draw a run chart using the critical ratio values you calculated. Describe your interpretation of the results, Investigate immediately 1.3 Investigate at Lesure 1.2 Ignore 1.0 Ignore 0.9 Watch Carefully 0.0 Investigate immediately 0.6 Inform Management Page 7 of 8 . Problem + (50 Points). Use the provided project data to answer the questions below. Assume the following: For determining the planned value per-week, assume that the budgeted amount for cach activity is evenly distributed across each week of its planned duration. For example, assume that an activity has a budget or $15,000 and a three-week duration, occurring during weeks 5,6, and 7 In that case, the planned value for that activity during weeks 5, 6, and 7 is $5.000 each week. For earned value calculations, use the percent complete method, with simple proportional cared value assignments The actual cost amounts are incurred during the week in which they are reported. The amounts in the table ARE NOT cumulative. The percent complete values in each column ARE cumulative. . . Activity Pred TE Budgeted Cost Actual Cost Actual Cost Daring Week 1 $23.000 0 % Compl. End of Week 1 100 % Compl. End of Week 2 100 76 Compl. End of Week 3 100 Actual Cost During Week 4 0 During A 1.0 None Weeks 0 Compl. End of Week 4 100 100 B 3.0 4.0 0 Actual Cost During Week 2 0 $14,000 58.000 $5,000 0 0 Actual Cost During Week 3 0 $12.000 $10,000 $6,000 0 D 0 0 50 25 90 50 Compl End of Week 5 100 100 100 100 25 $3.500 $7.500 $6.50C 75 0 $7,500 $25.000 $33,000 $28.000 $20,000 $18,000 $30,000 $24.000 $35,000 2.0 0 0 66 100 E 0 33 0 B 0 0 0 0 F 0 0 3.0 6.0 6.0 5.0 0 0 0 0 0 G D 0 o e o 0 0 0 $8,000 0 $5,000 $14,000 0 0 0 0 25 H 0 0 0 0 0 0 0 D EF. G H 33 1 2.0 $16,000 0 0 0 0 0 0 0 0 0 0 1. Solve the project network a. On a separate sheet. draw the activity network, using the AON method. b. Solve for the activity early start and finish times, late start and finish times, slack times, and the project completion time. c. Identify the critical path. Page 4 of 8 2. Complete the earned value table. Use the complete and actual cost data from Problem 1. and the planned value amounts from your network diagram. You may report planned (P) and actual (A) values in each cell. The project status is currently at the end of week five Activity 1 2 + 5 SS 53 Sis B sls sls C sis SIE els sis D * sls os sis 12 E 13 I sls als als sls sls sls 3 ss ss ss sls - G sls sls ss ss ss 53 ss 55 513 H 30 sls sls 1 SE Ds Page 5 of 8 3. Calculate the following project metrics: a. Budgeted cost at completion (BAC)- b. Original Estimated time to complete (ETC) - c. Determine the following values as of the ends of weeks 1. 2. 3. and 4: End of Week 1 End of Week 2 End of Week 3 End of Week 4 End of Week 5 Value Planned Value (PV) Earned Value (EV) Actual Cost (AC) Schedule Performance Index (SPI) Cost Performance Index (CPI) Critical Ratio (CSI) Estimated Cost at Completion Estimated Time to Completion 4. Use the provided template to draw a run chart using the critical ratio values you calculated. Describe your interpretation of the results, Investigate immediately 1.3 Investigate at Lesure 1.2 Ignore 1.0 Ignore 0.9 Watch Carefully 0.0 Investigate immediately 0.6 Inform Management Page 7 of 8