

Answered step by step
Verified Expert Solution
Question
1 Approved Answer
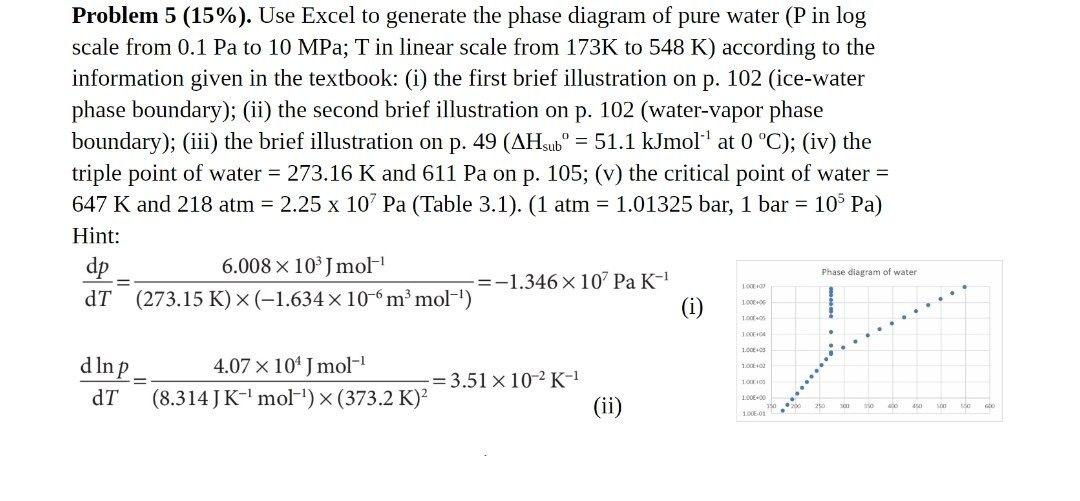
Problem 5(15%). Use Excel to generate the phase diagram of pure water (P in log scale from 0.1Pa to 10MPa; T in linear scale from
Step by Step Solution
There are 3 Steps involved in it
Step: 1

Get Instant Access to Expert-Tailored Solutions
See step-by-step solutions with expert insights and AI powered tools for academic success
Step: 2

Step: 3
Ace Your Homework with AI
Get the answers you need in no time with our AI-driven, step-by-step assistance
Get Started
Introduction To Software For Chemical Engineers
Authors: Mariano Martín Martín
2nd Edition
1138324213, 978-1138324213