Answered step by step
Verified Expert Solution
Question
1 Approved Answer
Problem 7 [12 points]. Using the sampling procedure covered in class and python (or any other way you see fit), generate N samples for the
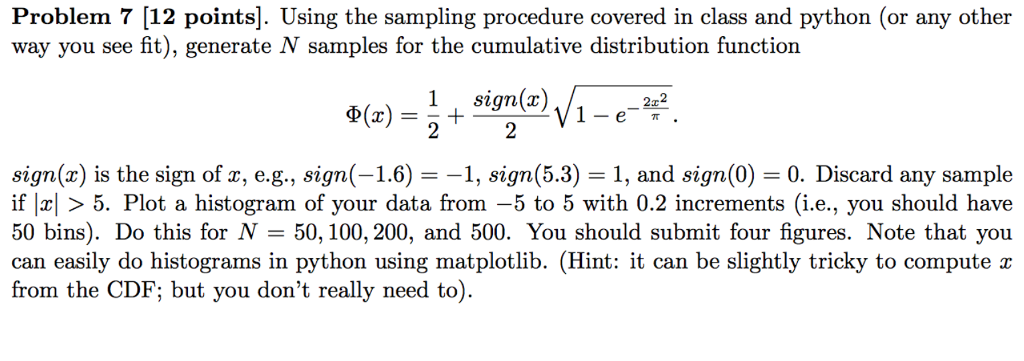
Problem 7 [12 points]. Using the sampling procedure covered in class and python (or any other way you see fit), generate N samples for the cumulative distribution function sign(x) sign(z) is the sign of z, e.g., sign(-1.6) =-1, sign(53) 1, and sign(0-0. Discard any sample if Ixl 5. Plot a histogram of your data from-5 to 5 with 0.2 increments (i.e., you should have 50 bins). Do this for N = 50, 100, 200, and 500, You should submit four figures. Note that you can easily do histograms in python using matplotlib. (Hint: it can be slightly tricky to compute r from the CDF; but you don't really need to. Problem 7 [12 points]. Using the sampling procedure covered in class and python (or any other way you see fit), generate N samples for the cumulative distribution function sign(x) sign(z) is the sign of z, e.g., sign(-1.6) =-1, sign(53) 1, and sign(0-0. Discard any sample if Ixl 5. Plot a histogram of your data from-5 to 5 with 0.2 increments (i.e., you should have 50 bins). Do this for N = 50, 100, 200, and 500, You should submit four figures. Note that you can easily do histograms in python using matplotlib. (Hint: it can be slightly tricky to compute r from the CDF; but you don't really need to
Step by Step Solution
There are 3 Steps involved in it
Step: 1
Get Instant Access to Expert-Tailored Solutions
See step-by-step solutions with expert insights and AI powered tools for academic success
Step: 2
Step: 3
Ace Your Homework with AI
Get the answers you need in no time with our AI-driven, step-by-step assistance
Get Started