

Answered step by step
Verified Expert Solution
Question
1 Approved Answer
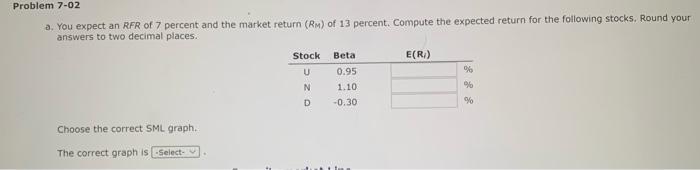
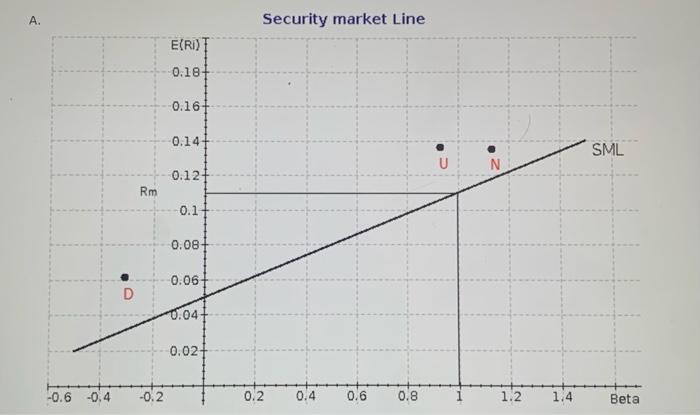
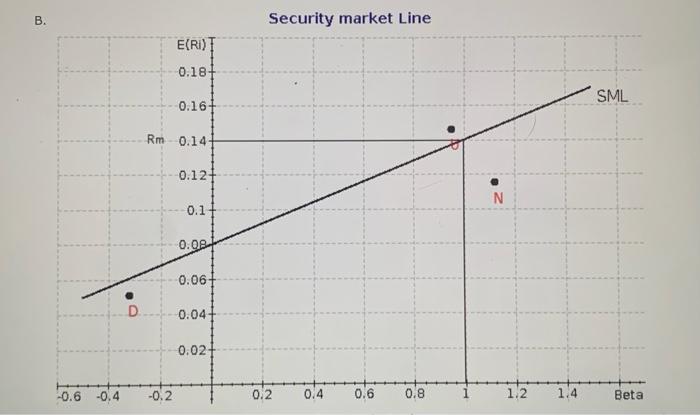
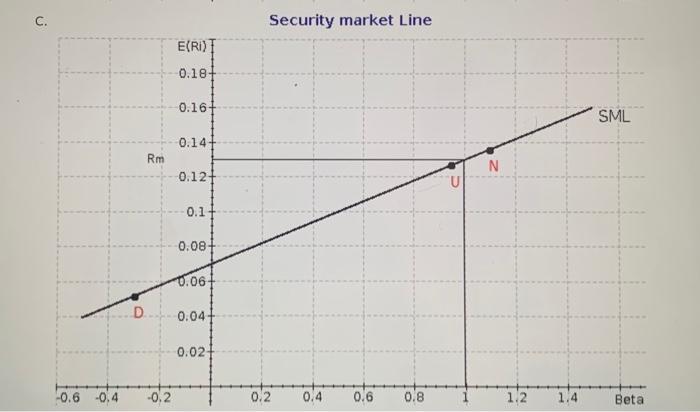
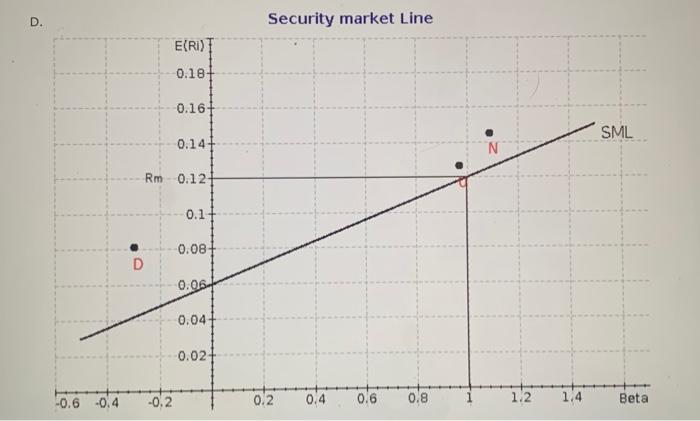
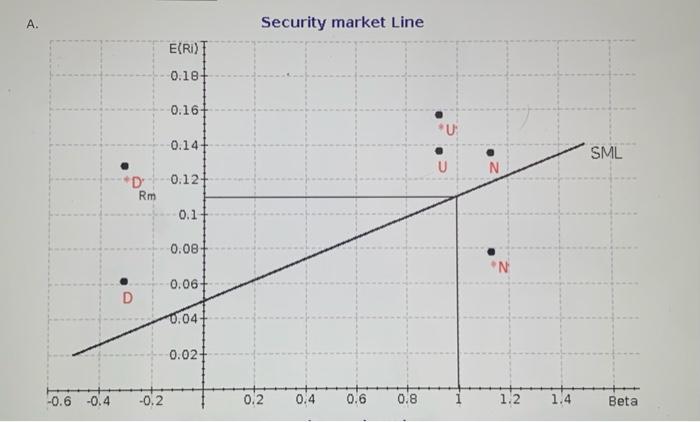
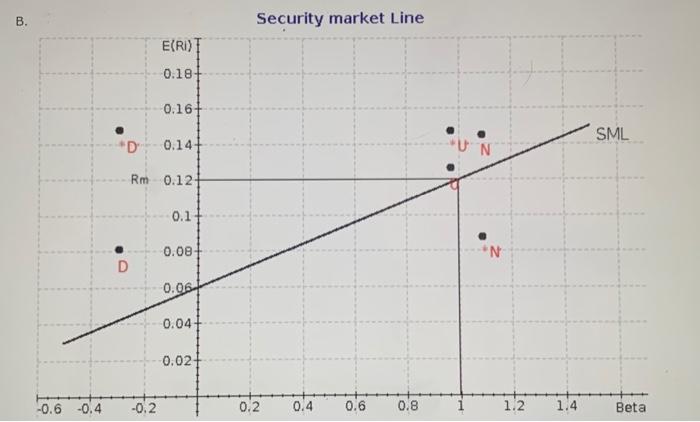
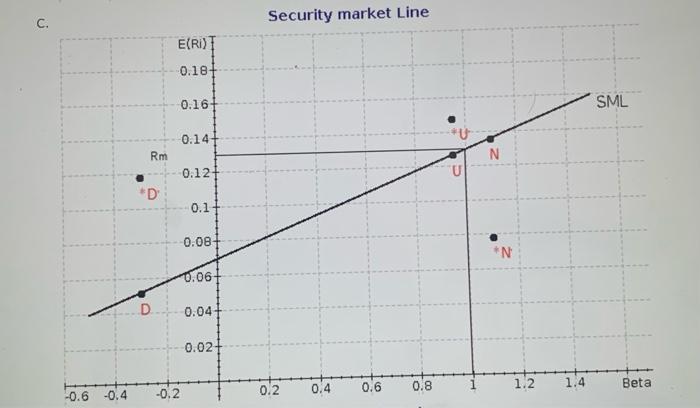
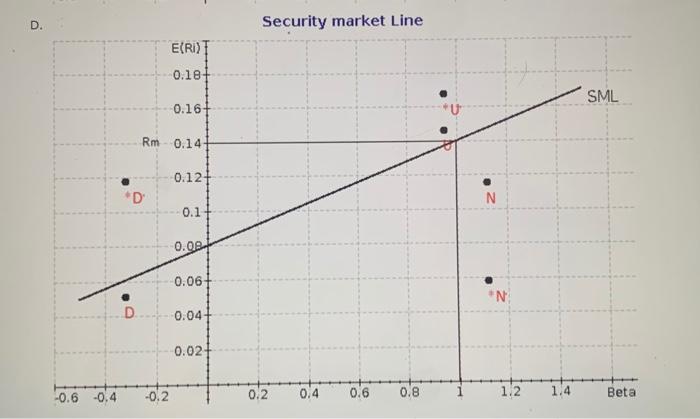
Problem 7-02 a. You expect an RFR of 7 percent and the market return (R) of 13 percent. Compute the expected return for the following
Step by Step Solution
There are 3 Steps involved in it
Step: 1

Get Instant Access to Expert-Tailored Solutions
See step-by-step solutions with expert insights and AI powered tools for academic success
Step: 2

Step: 3
Ace Your Homework with AI
Get the answers you need in no time with our AI-driven, step-by-step assistance
Get Started
Multivariate Methods And Forecasting With IBM SPSS Statistics
Authors: Abdulkader Aljandali
1st Edition
3319564803,3319564811