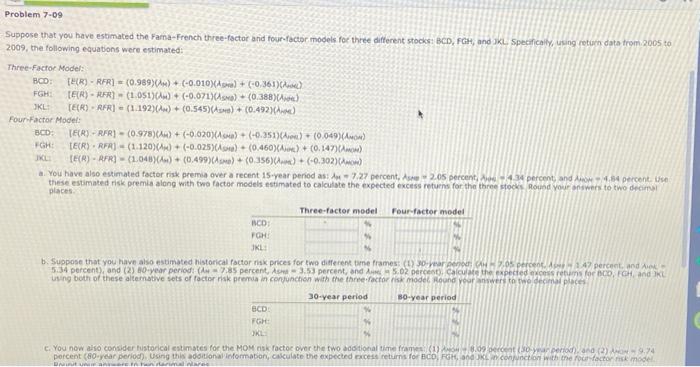
Problem 7.09 Suppose that you have estimated the Fama French three-factor and four factor models for three different stocks: BCD, FGH, and KL Specifically, using return data from 2005 to 2009, the following equations were estimated: NGH Three-Factor Models BOD TER) RFR] =(0.989)+(-0.010XA) + (-0.361) FGH TER) - RFR) (1.091)() + (-0.071)) (0.388).) SKL TER) RFR] =(1-192)(4) + (0.545)(0) + (0.492) Four Factor Model BCD TER) - RFR) - (0.978)(A) + (-0.020)(A) + (-0.351) (0.049)(AMO) LER) RFA) (1:120)(4) + (-0.025)) (0.460XA) (0.147) IKL (ECA) - ARI-(1,048)() + (0.499)() + (0.356)) + (-0.302)(OH) a. You have also estimated factor risk premia over a recent 15 year period as: -7.27 percent, 2.05 percent 4 percent and A4.4 percent. Use these estimated risk premia along with two factor models estimated to calculate the expected excess returns for the three stocks Round your answers to two decim places Three-factor model Four factor model ACD FGH JKE b. Suppose that you have also estimated historical factor risk prices for two different time frames (1) 30 year ned: 05 percent. 14 percent and 5.34 percent), and (2) 80-year periodi (A - 785 percent, A3,53 percent, and 5.02 percent cu the expected excess retums for Co, FGH and using both of these alternative sets of factor risk premia in conjunction with the the factorisk model Round your answers to the decimal places 30-year period B0-year period BCD FGH KL c. You now also consider historical estimates for the MOM skractor over the two additional time frame 9.02 30 year period (2) A4 percent (80year period. Using this additional information, calculate the expected excess returns for BCD, FGH, 100 UK.concion with the four factor model Dar 30-year period 80-year period BCD % % FGH: % UKL: % d. Do all of the expected excess returns you calculated in part () and part (6) make sense? If not, identify which ones seem inconsistent with asset pricing theory and discuss why The excess retums for Select y for all periods seem moderately large. This is partly due to the fact that the regressions unlike factor risk premia were estimated using data from muchSelect periods. Problem 7.09 Suppose that you have estimated the Fama French three-factor and four factor models for three different stocks: BCD, FGH, and KL Specifically, using return data from 2005 to 2009, the following equations were estimated: NGH Three-Factor Models BOD TER) RFR] =(0.989)+(-0.010XA) + (-0.361) FGH TER) - RFR) (1.091)() + (-0.071)) (0.388).) SKL TER) RFR] =(1-192)(4) + (0.545)(0) + (0.492) Four Factor Model BCD TER) - RFR) - (0.978)(A) + (-0.020)(A) + (-0.351) (0.049)(AMO) LER) RFA) (1:120)(4) + (-0.025)) (0.460XA) (0.147) IKL (ECA) - ARI-(1,048)() + (0.499)() + (0.356)) + (-0.302)(OH) a. You have also estimated factor risk premia over a recent 15 year period as: -7.27 percent, 2.05 percent 4 percent and A4.4 percent. Use these estimated risk premia along with two factor models estimated to calculate the expected excess returns for the three stocks Round your answers to two decim places Three-factor model Four factor model ACD FGH JKE b. Suppose that you have also estimated historical factor risk prices for two different time frames (1) 30 year ned: 05 percent. 14 percent and 5.34 percent), and (2) 80-year periodi (A - 785 percent, A3,53 percent, and 5.02 percent cu the expected excess retums for Co, FGH and using both of these alternative sets of factor risk premia in conjunction with the the factorisk model Round your answers to the decimal places 30-year period B0-year period BCD FGH KL c. You now also consider historical estimates for the MOM skractor over the two additional time frame 9.02 30 year period (2) A4 percent (80year period. Using this additional information, calculate the expected excess returns for BCD, FGH, 100 UK.concion with the four factor model Dar 30-year period 80-year period BCD % % FGH: % UKL: % d. Do all of the expected excess returns you calculated in part () and part (6) make sense? If not, identify which ones seem inconsistent with asset pricing theory and discuss why The excess retums for Select y for all periods seem moderately large. This is partly due to the fact that the regressions unlike factor risk premia were estimated using data from muchSelect periods


