Problem 7-14 Consider the data contained in the table below, which lists 30 monthly excess returns to two different actively managed stock portfolios (A and B) and three different common risk factors (1, 2, and 3). (Note: You may find it useful to use a computer spreadsheet program such as Microsoft Excel to calculate your answers.) Period 1 2 3 4 5 6 7 8 9 10 11 12 13 14 15 16 17 18 19 20 21 22 23 24 25 26 27 28 29 30 Portfolio A Portfolio B 1.13% 0.00% 6.54 7.63 5.09 5.96 1.24 0.31 -1.93 -1.56 4.17 -0.77 -15.44 5.97 7.75 7.82 9.64 5.22 -3.19 5.46 2.30 -2.96 6.62 -3.42 -1.24 -1.57 6.08 1.96 7.13 1.01 9.08 -4.24 -3.34 3.95 2.31 -2.38 -15.39 4.13 6.82 5.46 4.83 2.76 -0.64 2.57 7.34 0.07 3.71 -0.58 -4.01 0.17 5.23 2.30 7.08 -2.78 -2.02 5.31 -3.05 -0.54 1.75 Factor 1 Factor 2 0.01% -0.98% 6.85 0.37 -1.53 4.67 0.39 -3.54 -3.49 -4.59 -5.90 0.01 -3.36 1.29 -0.30 1.13 0.73 -3.02 2.85 -2.72 -16.21 5.96 7.05 5.91 5.88 3.37 -4.24 3.41 4.50 -2.30 4.78 -3.35 -1.42 -2.59 5.81 3.20 7.80 -4.51 2.50 5.22 -6.28 -4.17 4.58 -5.61 -3.91 2,82 3.48 3.36 1.95 -1.07 3.20 -6.47 7.80 7.00 4.14 21.43 -16.64 -7.50 -5.80 13.32 Factor 3 -1.62% -1.16 1.98 0.25 4.31 -1.54 -1.75 5.78 -3.75 -2.83 -3.76 -5.04 -6.16 1.75 -3.09 2.76 3.01 -4.38 0.75 -1.18 -3.16 -3.26 -8.15 -9.11 -0.23 -11.97 7.72 8.61 5.31 -8.83 risk factors. Which of these coefficients are statistically significant at A-Z H O 9 A
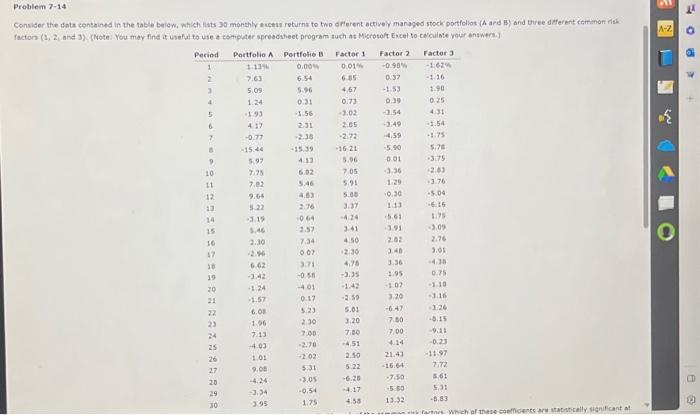
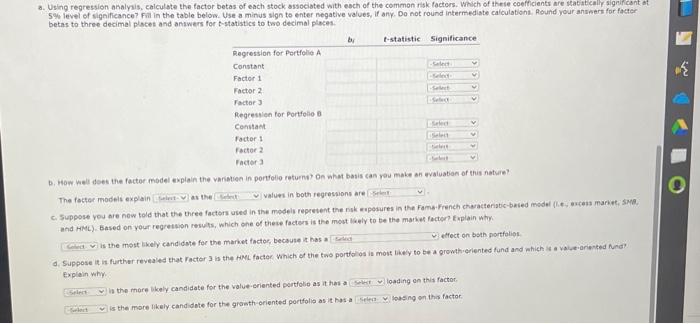
Problem 7-14 \begin{tabular}{|c|c|c|c|c|c|} \hline Period & Portfolio A & Pertfotio B & Factor 1 & Factor 2 & Factor 3 \\ \hline 1 & 5.134% & 0.00w & 0.01% & 0.99% & 1.62% \\ \hline 2 & 7.63 & 6.54 & 685 & 0.37 & -1.16 \\ \hline 3 & 5.09 & 5.96 & 4.67 & -1.53 & \\ \hline 4 & 1:24 & 0.31 & 0.73 & 0.30 & 0.25 \\ \hline 5 & -1.93 & -1.56 & =3.02 & 2.54 & 431 \\ \hline 6 & 417 & 231 & 2.05 & -2.49 & -1.54 \\ \hline 7 & -0.77 & 2.36 & -272 & 4.59 & -3.75 \\ \hline e & -15.44 & -15.39 & -1621 & 5.90 & 5.7t \\ \hline 9 & 5.97 & 417 & 5.96 & 0.01 & \\ \hline 10 & 7.75 & 6.02 & 7.05 & -3.36 & \\ \hline 11 & 7,82 & 5.46 & 5.91 & 1:29 & .3 .76 \\ \hline 12 & 9.64 & 4.83 & 5.08 & 0.30 & -5.04 \\ \hline 11 & 3.22 & 2.76 & 3.37 & 1:13 & =6.16 \\ \hline 14 & -3.15 & -064 & -424 & 5.61 & 1.78 \\ \hline is & 3.46 & 2.57 & 341 & 3.91 & -3.09 \\ \hline 16 & 2.10 & 7,34 & 4.50 & & 2.76 \\ \hline 17 & 2.76 & 007 & 12.30 & 3.48 & 3.01 \\ \hline 18 & 6.62 & 371 & 4,75 & 3.36 & -438 \\ \hline 19 & -3.42 & 0.5n & -2.35 & 1.95 & 0.75 \\ \hline 20 & 124 & -401 & -1.42 & +1.07 & -1.13 \\ \hline 21 & -1.57 & 0.17 & -2.50 & 3.20 & -3.16 \\ \hline 22 & 6.08 & 5.23 & 5.01 & -647 & -1226 \\ \hline 23 & 1,06 & 230 & 3.20 & 7.50 & -9.15 \\ \hline 24 & 7.13 & 7.00 & 700 & 7,00 & -9.18 \\ \hline 25 & -4.03 & -2.78 & -4.51 & 4.14 & -0.23 \\ \hline 26 & 1.01 & -2.02 & 2.50 & 21,41 & -1197 \\ \hline 27 & & 5.31 & 5.22 & -16.64 & 7,72 \\ \hline 20 & -4.24 & -3.05 & -6.28 & 2750 & 5.61 \\ \hline 29 & -3.34 & -0.54 & -4.17 & -5.80 & 5,31 \\ \hline 30 & 3.95 & 125 & 4.58 & 13.32 & -8.83 \\ \hline \end{tabular} a. Using regression analyis, calculate the factor betas of each stock sssociated with each of the common risk factors. Which of theie coefficients are statiticalir significant of betas to three decimal places and answers for t-statistics to two decimal places. b. How well does the factor mbdel explain the variatien in portolio returnt? On what basis can rou male an waluation of this nature? The focter models explain as the values in both regressions are is the most likely candidate for the market factor, because it has a Explain why. Wh the mare Maly candidate for the value-eriented pertfolie as it hes a loading on this factor. is the more likely candidote for the growth-oriented portfolis as it has a iosing on tha factor. Problem 7-14 \begin{tabular}{|c|c|c|c|c|c|} \hline Period & Portfolio A & Pertfotio B & Factor 1 & Factor 2 & Factor 3 \\ \hline 1 & 5.134% & 0.00w & 0.01% & 0.99% & 1.62% \\ \hline 2 & 7.63 & 6.54 & 685 & 0.37 & -1.16 \\ \hline 3 & 5.09 & 5.96 & 4.67 & -1.53 & \\ \hline 4 & 1:24 & 0.31 & 0.73 & 0.30 & 0.25 \\ \hline 5 & -1.93 & -1.56 & =3.02 & 2.54 & 431 \\ \hline 6 & 417 & 231 & 2.05 & -2.49 & -1.54 \\ \hline 7 & -0.77 & 2.36 & -272 & 4.59 & -3.75 \\ \hline e & -15.44 & -15.39 & -1621 & 5.90 & 5.7t \\ \hline 9 & 5.97 & 417 & 5.96 & 0.01 & \\ \hline 10 & 7.75 & 6.02 & 7.05 & -3.36 & \\ \hline 11 & 7,82 & 5.46 & 5.91 & 1:29 & .3 .76 \\ \hline 12 & 9.64 & 4.83 & 5.08 & 0.30 & -5.04 \\ \hline 11 & 3.22 & 2.76 & 3.37 & 1:13 & =6.16 \\ \hline 14 & -3.15 & -064 & -424 & 5.61 & 1.78 \\ \hline is & 3.46 & 2.57 & 341 & 3.91 & -3.09 \\ \hline 16 & 2.10 & 7,34 & 4.50 & & 2.76 \\ \hline 17 & 2.76 & 007 & 12.30 & 3.48 & 3.01 \\ \hline 18 & 6.62 & 371 & 4,75 & 3.36 & -438 \\ \hline 19 & -3.42 & 0.5n & -2.35 & 1.95 & 0.75 \\ \hline 20 & 124 & -401 & -1.42 & +1.07 & -1.13 \\ \hline 21 & -1.57 & 0.17 & -2.50 & 3.20 & -3.16 \\ \hline 22 & 6.08 & 5.23 & 5.01 & -647 & -1226 \\ \hline 23 & 1,06 & 230 & 3.20 & 7.50 & -9.15 \\ \hline 24 & 7.13 & 7.00 & 700 & 7,00 & -9.18 \\ \hline 25 & -4.03 & -2.78 & -4.51 & 4.14 & -0.23 \\ \hline 26 & 1.01 & -2.02 & 2.50 & 21,41 & -1197 \\ \hline 27 & & 5.31 & 5.22 & -16.64 & 7,72 \\ \hline 20 & -4.24 & -3.05 & -6.28 & 2750 & 5.61 \\ \hline 29 & -3.34 & -0.54 & -4.17 & -5.80 & 5,31 \\ \hline 30 & 3.95 & 125 & 4.58 & 13.32 & -8.83 \\ \hline \end{tabular} a. Using regression analyis, calculate the factor betas of each stock sssociated with each of the common risk factors. Which of theie coefficients are statiticalir significant of betas to three decimal places and answers for t-statistics to two decimal places. b. How well does the factor mbdel explain the variatien in portolio returnt? On what basis can rou male an waluation of this nature? The focter models explain as the values in both regressions are is the most likely candidate for the market factor, because it has a Explain why. Wh the mare Maly candidate for the value-eriented pertfolie as it hes a loading on this factor. is the more likely candidote for the growth-oriented portfolis as it has a iosing on tha factor