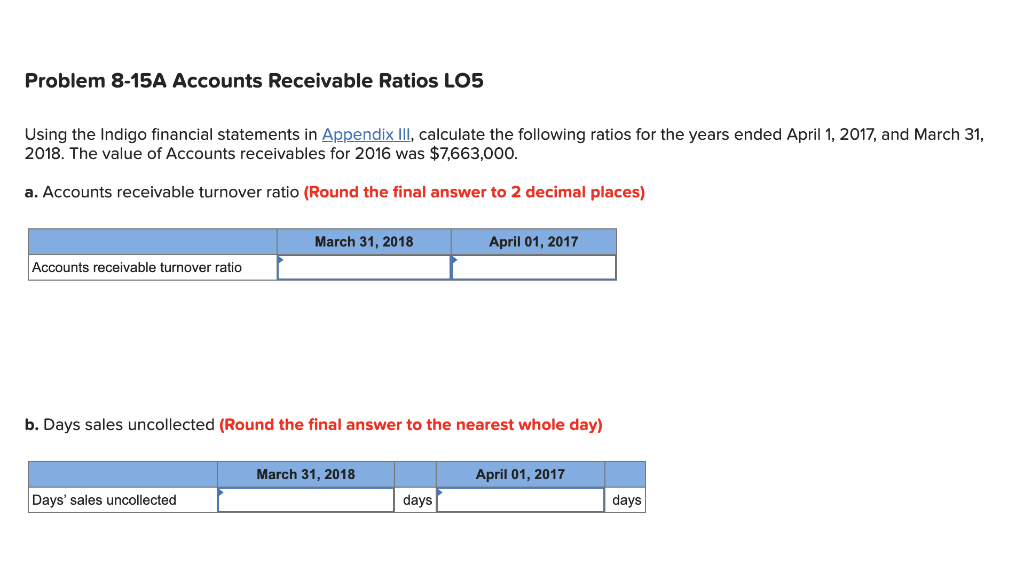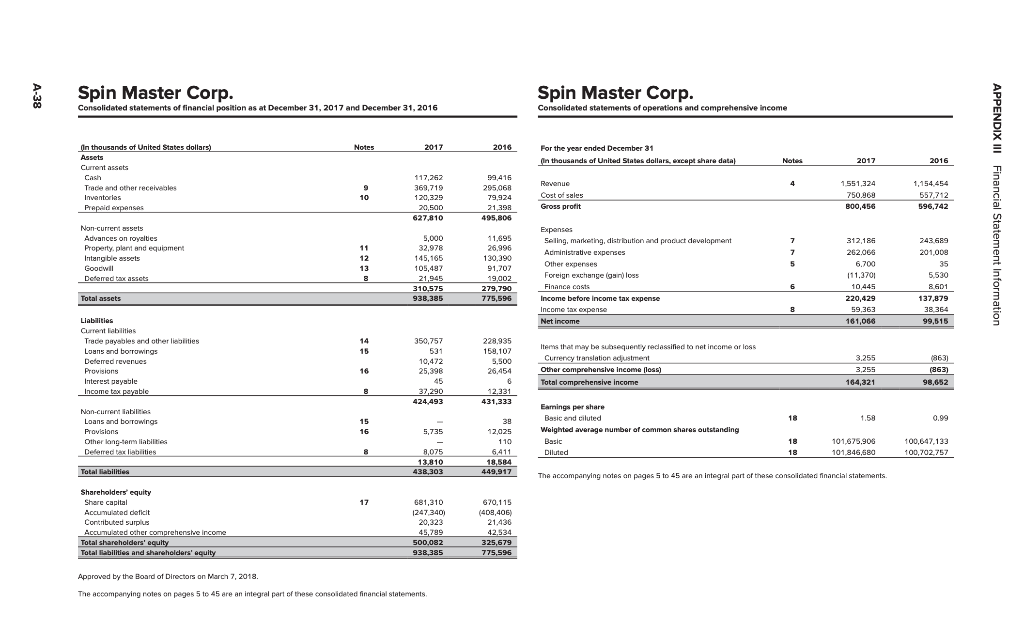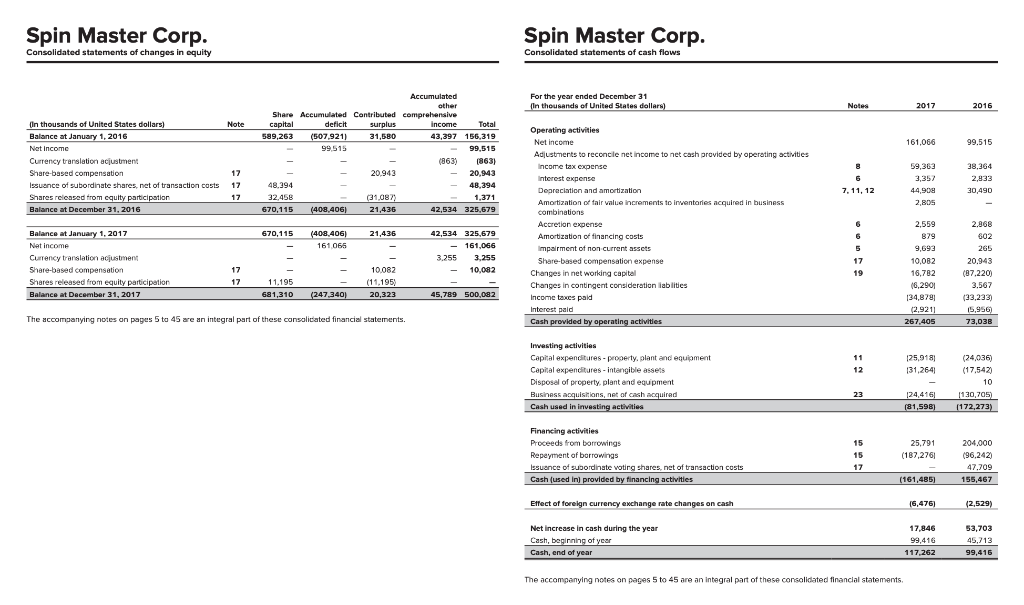


Problem 8-15A Accounts Receivable Ratios LO5 Using the Indigo financial statements in Appendix III, calculate the following ratios for the years ended April 1, 2017, and March 31, 2018. The value of Accounts receivables for 2016 was $7,663,000. a. Accounts receivable turnover ratio (Round the final answer to 2 decimal places) March 31, 2018 April 01, 2017 Accounts receivable turnover ratio b. Days sales uncollected (Round the final answer to the nearest whole day) March 31, 2018 April 01, 2017 Days' sales uncollected days days A-38 Spin Master Corp. Spin Master Corp. Consolidated statements of operations and comprehensive income Consolidated statements of financial position as at December 31, 2017 and December 31, 2016 , Notes 2017 2016 For the year ended December 31 (In thousands of United States dollars, except share data) Notes 2017 2016 In thousands of United States dollars) Assets Current assets Cash Trade and other receivables Inventorias Prepaid expenses 4 9 10 117,262 369,719 120,325 20,500 627,810 59,416 295,068 79,924 21,39 495,806 405 80 Revenue Cost of sales Gross profit 1551,324 750.969 B00,456 1,154454 557,712 596,742 APPENDIX III Financial Statement Information Non current assets Advances on royalties Property, plant and equiomery Intangible asset Goodwil Deferred tax assets 11 1 12 13 8 5,000 32,978 145,166 105,487 21,945 310,575 938.385 7 7 5 11.695 26.996 130,390 91.707 19,002 279,790 775,596 Expanses Selling, marketing, distribution and product development Administrative expenses Other expenses Foreign exchange garlos Finance costs Income before income tax expense Income tax expense Net Income 312,181 262.066 6.700 111.3701 10 445 220,429 59,363 161,066 243 689 201,008 35 5,530 8.601 137,879 38,364 99,515 6 Total assets 8 8 14 16 Liabilities Current liabilities Trace payables and other lilities Loans and borrowings Deferred revenues Provisions Interest guyable Income tax payable 350,757 531 10,472 25,396 45 37,290 424.493 228,935 159,107 5.500 26.454 Items that may be subsequentradassified to net income or loss Currency translation adjustment Other comprehensive income (los) Total comprehensive income 16 3.255 3,255 164,321 (863) (863) 98,652 8 12.331 431,333 18 1.58 0.99 Nan-curreras Loans and borrowings Provisions Other long-term liabilities Deferred tax liabilities 15 16 5,735 Eaminge per share Basic and iluted Weighted average number of common shares outstanding Basic Diluted 38 12.025 110 6.411 18,584 449,917 18 101,675,906 101.846,680 100,647,133 100,702.757 18 8,075 13.810 438,303 Total liabilities The accompanying notes on pages 5 to 45 are an integral part of these consolidated financial statements 17 Shareholders' equity Share capital Accumulated deficit Contributed surplus Accumulated other comprehensive income Total shareholders' equity Total liabilities and shareholders' equity 681,310 1247 340) 20,323 45.799 500.082 938,385 670,115 (408,406) 21,436 42.534 325,679 775,596 Approved by the Board of Directors on March 7, 2018, The accompanying roles on piges 5 to 45 are an integral part of these consolidated financial statements Spin Master Corp. Spin Master Corp. Consolidated statements of changes in equity Consolidated statements of cash flows For the year ended December 31 In thousands of United States dollars) Notes 2017 2016 Note 161,066 99.515 (In thousands of United States dollars) Balance at January 1, 2016 Net Income Currency translation acjustment Share-based compensation Issuance of subordinate shares, net of transaction costs Shares released from cquity participation Balance at December 31, 2016 Accumulated other Share Accumulated Contributed comprehensive capital deficit surplus income Total 589,263 (507,9211 31,580 43,397 156,319 99515 99,515 (863) (863) ( 20.943 20,943 48.394 48.394 32,458 (31.087) 1,371 670,115 (408,406) 21,436 42,534 325,679 8 17 17 59,363 3,357 44,900 2.805 38,364 2,833 30,490 7. 11, 12 17 Operating activities Net income Adjustments to reconcile net income to net cash provided by operating activities Income tax expense Interest expense Depreciation and amortization Amortization of fair value increments to inventaries acquired in business combinations Accretion expense Amortization of financing costs Impairment of non current assets Share-based compensation expense Changes in networking capital Changes in contingent consideration abilities Income taxes paid Interest paid Cash provided by operating activities 670,115 21,436 (408,406) 161 066 6 6 6 Balance at January 1, 2017 Net Income Currency translation acjustment Share-based compensation Shares released from equity participation Balance at December 31, 2017 42,534 325,679 - 161,066 3.255 3.255 10.082 5 17 17 17 19 2,559 879 9,693 10,082 16,782 (8,2901 134,8791 (2,9211 267,405 10,082 (11.195) 20,323 2.968 602 265 20.943 (87.220) 3.567 (33,233) 15,956) 73,038 11.195 681,310 (247,340) 45.789 500,082 The accompanying notes on pages 5 to 45 are an integral part of these consolidated financial statements. 11 125,9181 131,264 12 Investing activities Capital expenditures-property, plant and equipment Capital expenditures - Intangible assets Disposal of property, plant and equipment Business acquisitions, not of cash acquired Cash used in investing activities (24,036 (17,542 10 11.30,705) [172,273) 23 124,416 (81,598) 15 Financing activities Proceeds from borrowings Repeyment of borrowings Issuance of subordinate votirg shares, net of transaction costs Cash (used in provided by financing activities 25,791 (187,276 15 204.000 (96,242) 47.709 155,467 17 (161,485) Effect of foreign currency exchange rate changes on cash 16,476) (2,529) Net increase in cash during the year Cash, beginning of year Cash, end of year 17,846 99,416 117,262 53,703 45,713 99,416 The accompanying notes on pages 5 to 45 are an integral part of these consolidated financial statements


