Answered step by step
Verified Expert Solution
Question
1 Approved Answer
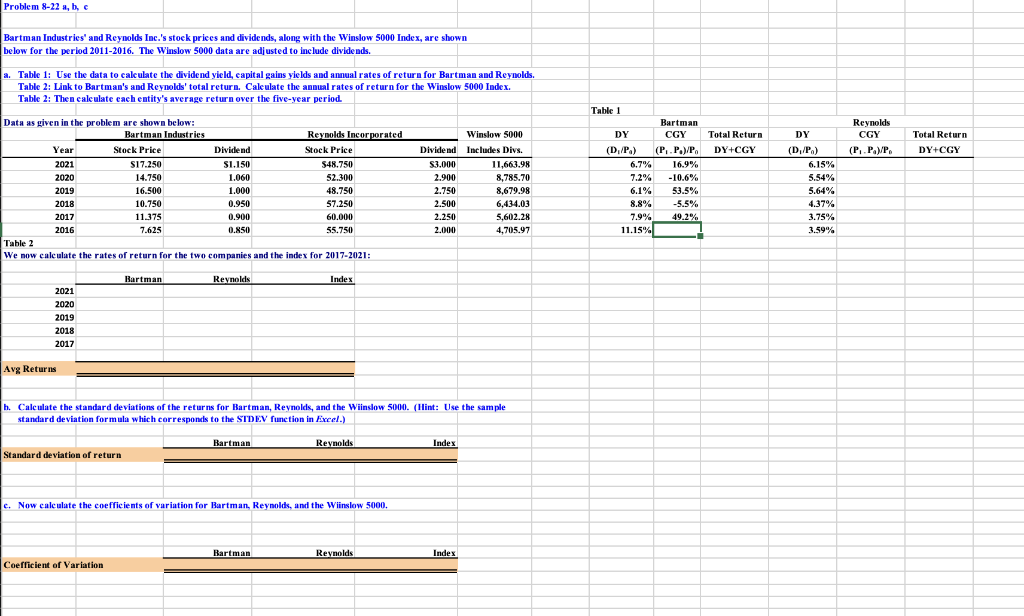
Problem 8-22 a, b, c Bartman Industries and Reynolds Inc.'s stoek priees and dividends, along with the Winslow 5000 Index, are shown below for the
Problem 8-22 a, b, c Bartman Industries" and Reynolds Inc.'s stoek priees and dividends, along with the Winslow 5000 Index, are shown below for the period 2011-2016. The Winslow 5000 data are adj usted to include divideads. a. Table 1: Use the data to calculate the dividend yield, eapital gains yields and annual rates of return for Bartman and Reynolds. Table 2: Link to Bartman's and Reynolds' total return. Caleulate the annual rates of return for the Winslow 5000 Index. Table 2: Then ealeulate each eatity's average return over the five-year period. Table 1 Thable 2 We now calculate the rates of return for the two companies and the index for 2017-2021: \begin{tabular}{|r|r|r|r|} \hline & Bartman & Reynolds & Index \\ \hline 2021 & & & \\ \hline 2020 & & \\ \hline 2019 & & \\ \hline 2018 & & \\ \hline 2017 & & \\ \hline Ave Returns & \\ \hline \hline \end{tabular} h. Calculate the standard deviations of the returns for Bartman, Reynolds, and the Wiinslow 5000. (Ilint: Use the sample standard deviation formula which cerresponds to the STDEV function in Fincel.) Standard deviation of return c. Now calculate the coefficients of variation for Bartman, Reynolds, and the Wiinslow 5000 . Coefficient of Variation \begin{tabular}{lll} Bartman & Reynolds Index \\ \hline \hline \end{tabular}
Step by Step Solution
There are 3 Steps involved in it
Step: 1
Get Instant Access to Expert-Tailored Solutions
See step-by-step solutions with expert insights and AI powered tools for academic success
Step: 2
Step: 3
Ace Your Homework with AI
Get the answers you need in no time with our AI-driven, step-by-step assistance
Get Started