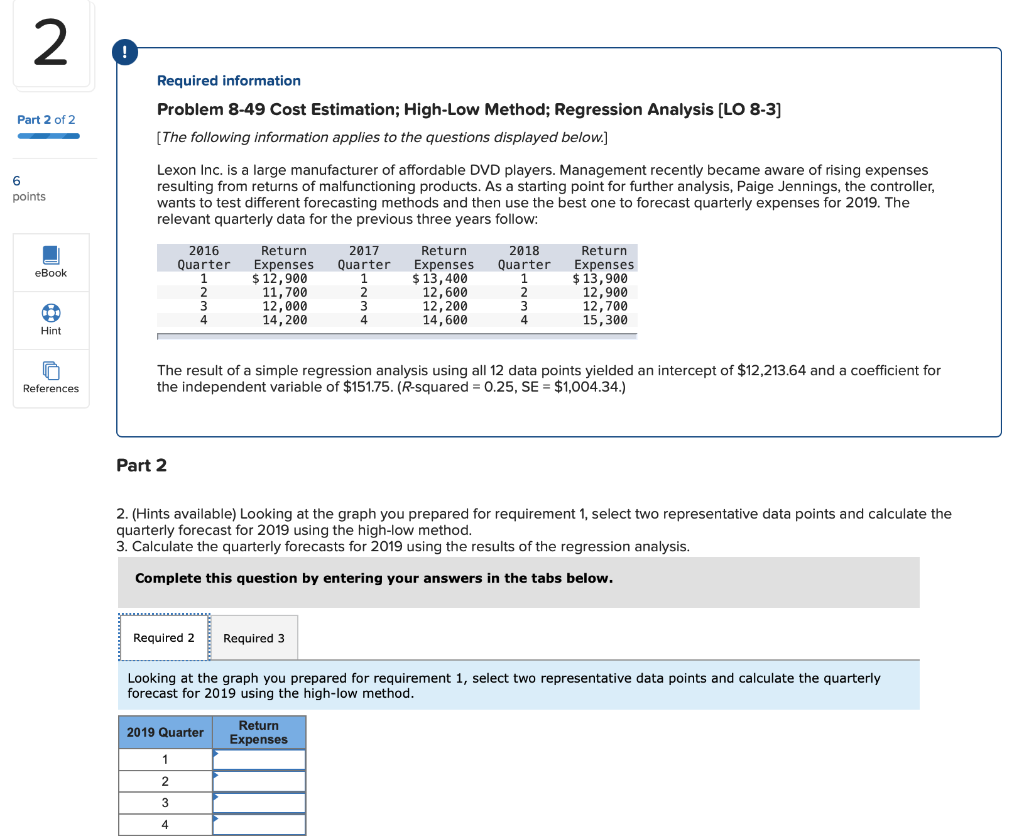
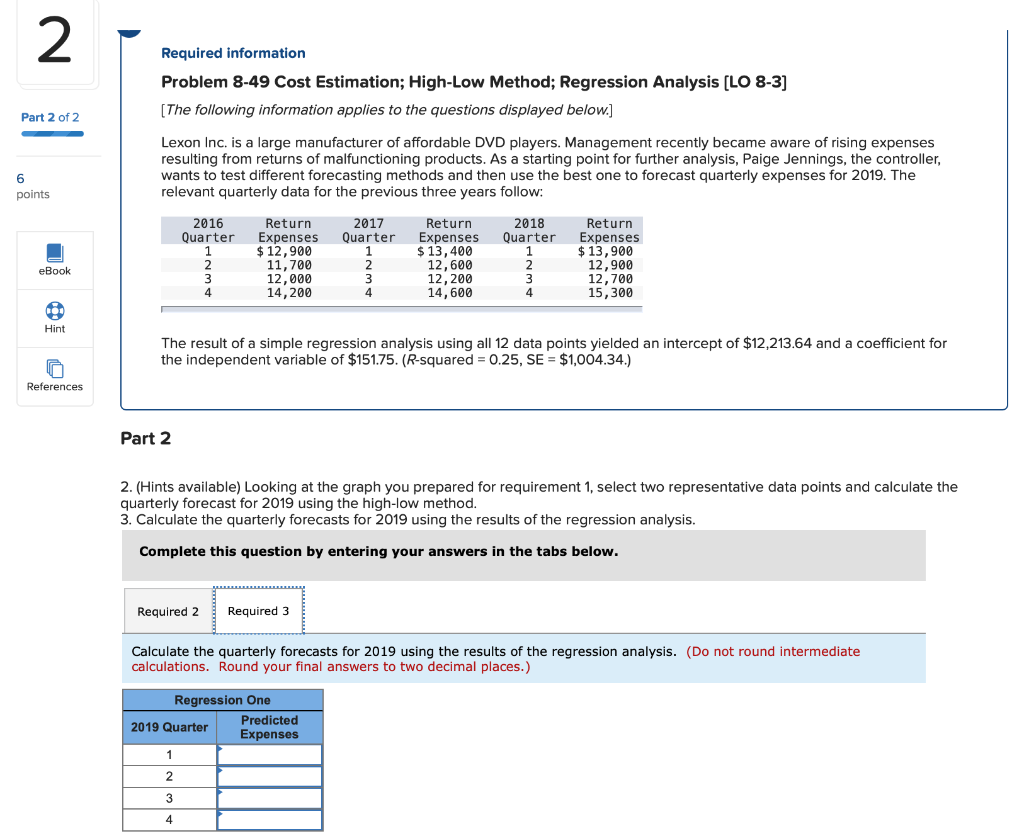
Problem 8-49 Cost Estimation; High-Low Method; Regression Analysis [LO 8-3] [The following information applies to the questions displayed below.] Lexon Inc. is a large manufacturer of affordable DVD players. Management recently became aware of rising expenses resulting from returns of malfunctioning products. As a starting point for further analysis, Paige Jennings, the controller, wants to test different forecasting methods and then use the best one to forecast quarterly expenses for 2019 . The relevant quarterly data for the previous three years follow: The result of a simple regression analysis using all 12 data points yielded an intercept of $12,213.64 and a coefficient for the independent variable of $151.75. (R-squared =0.25,SE=$1,004.34.) Part 2 2. (Hints available) Looking at the graph you prepared for requirement 1, select two representative data points and calculate the quarterly forecast for 2019 using the high-low method. 3. Calculate the quarterly forecasts for 2019 using the results of the regression analys Complete this question by entering your answers in the tabs below. Looking at the graph you prepared for requirement 1, select two representative data points and calculate the quarterly forecast for 2019 using the high-low method. Problem 8-49 Cost Estimation; High-Low Method; Regression Analysis [LO 8-3] [The following information applies to the questions displayed below.] Lexon Inc. is a large manufacturer of affordable DVD players. Management recently became aware of rising expenses resulting from returns of malfunctioning products. As a starting point for further analysis, Paige Jennings, the controller, wants to test different forecasting methods and then use the best one to forecast quarterly expenses for 2019 . The relevant quarterly data for the previous three years follow: The result of a simple regression analysis using all 12 data points yielded an intercept of $12,213.64 and a coefficient for the independent variable of $151.75. (R-squared =0.25,SE=$1,004.34.) Part 2 2. (Hints available) Looking at the graph you prepared for requirement 1, select two representative data points and calculate the quarterly forecast for 2019 using the high-low method. 3. Calculate the quarterly forecasts for 2019 using the results of the regression analysis. Complete this question by entering your answers in the tabs below. Calculate the quarterly forecasts for 2019 using the results of the regression analysis. (Do not round intermediate calculations. Round your final answers to two decimal places.)