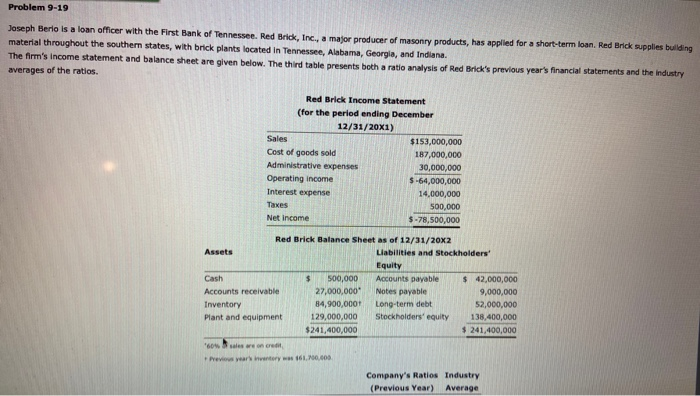
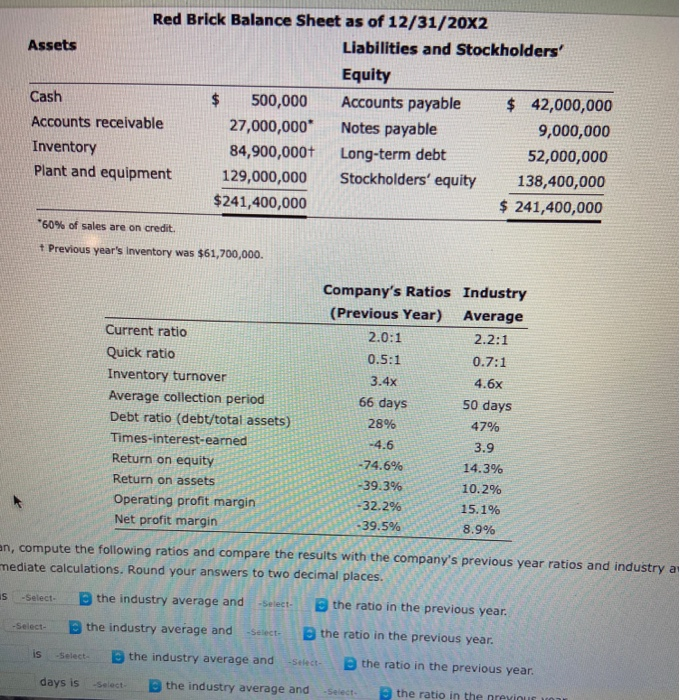
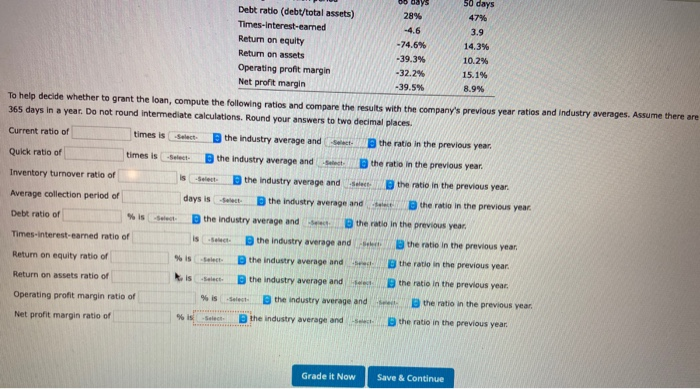
Problem 9-19 Joseph Berlo is a loan officer with the First Bank of Tennessee. Red Brick, Inc., a major producer of masonry products, has applied for a short-term loan. Red Brick supplies building material throughout the southern states, with brick plants located in Tennessee, Alabama, Georgia, and Indiana The firm's Income statement and balance sheet are given below. The third table presents both a ratio analysis of Red Brick's previous year's financial statements and the industry averages of the ratios. Red Brick Income Statement (for the period ending December 12/31/20X1) Sales $153,000,000 Cost of goods sold 187,000,000 Administrative expenses 30,000,000 Operating income $-64,000,000 Interest expense 14,000,000 Taxes 500,000 Net Income 5-78,500,000 Red Brick Balance Sheet as of 12/31/20X2 Assets Liabilities and Stockholders' Equity Cash $ 500,000 Accounts payable $ 42,000,000 Accounts receivable 27,000,000 Notes payable 9,000,000 Inventory 84,900,0001 Long-term debt 52,000,000 Plant and equipment 129,000,000 Stockholders' equity 138,400,000 $241,400,000 $ 241,400,000 60% sales are on credit Previous year's inventory 161.100.000 Company's Ratios Industry (Previous Year) Average Red Brick Balance Sheet as of 12/31/20X2 Assets Liabilities and Stockholders' Equity Cash $ 500,000 Accounts payable $ 42,000,000 Accounts receivable 27,000,000* Notes payable 9,000,000 Inventory 84,900,000+ Long-term debt 52,000,000 Plant and equipment 129,000,000 Stockholders' equity 138,400,000 $241,400,000 $ 241,400,000 *60% of sales are on credit. + Previous year's inventory was $61,700,000. Company's Ratios Industry (Previous Year) Average 2.0:1 2.2:1 0.5:1 0.7:1 3.4x 4.6x 50 days 28% 47% -4.6 3.9 74.6% 14.3% 39.3% 10.2% -32.2% 15.1% - 39.5% 8.9% Current ratio Quick ratio Inventory turnover Average collection period Debt ratio (debt/total assets) Times-interest-earned Return on equity Return on assets Operating profit margin Net profit margin 66 days an, compute the following ratios and compare the results with the company's previous year ratios and industry a mediate calculations. Round your answers to two decimal places. s -Select- the industry average and -Select- the ratio in the previous year. -Select- the industry average and -Select- the ratio in the previous year. is -Select- the industry average and -Select- the ratio in the previous year. days is the industry average and -Select the ratio in the previous 1 50 days Debt ratio (debt/total assets) 28% 47% Times-Interest-eamed -4.6 3.9 Return on equity -74.6% 14.3% Return on assets -39.3% 10.2% Operating profit margin -32.2% 15.1% Net profit margin -39.5% 8.9% To help decide whether to grant the loan, compute the following ratios and compare the results with the company's previous year ratios and industry averages. Assume there are 365 days in a year. Do not round intermediate calculations. Round your answers to two decimal places Current ratio of times is Select the industry average and att the ratio in the previous year. Quick ratio of times is the industry average and select the ratio in the previous year. Inventory turnover ratio of the industry average and the ratio in the previous year. Average collection period of days is Select the industry average and . the ratio in the previous year. Debt ratio of % is -Select the industry average and the ratio in the previous year. Times-interest-earned ratio of the industry average and the ratio in the previous year Return on equity ratio of % is Select B the industry average and the ratio in the previous year. Return on assets ratio of -Select the industry average and et the ratio in the previous year. Operating profit margin ratio of the industry average and the ratio in the previous year. Net profit margin ratio of % the industry average and sec the ratio in the previous year. Grade it Now Save & Continue