

Answered step by step
Verified Expert Solution
Question
1 Approved Answer
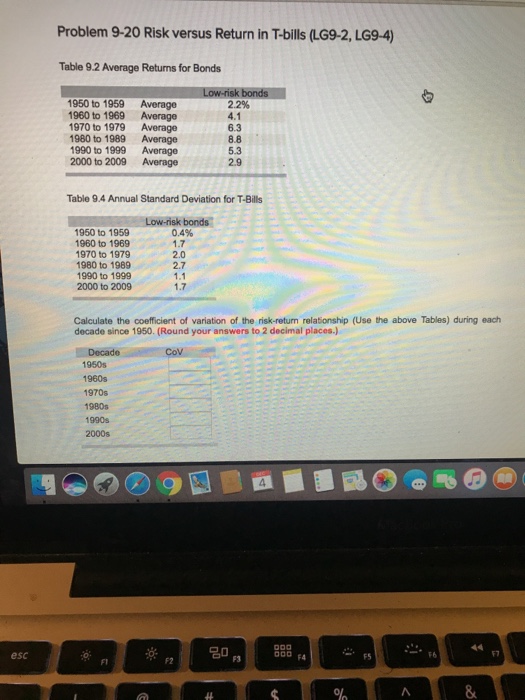
Problem 9-20 Risk versus Return in T-bills (LG9-2, LG9-4) Table 9.2 Average Returns for Bonds 1950 to 1959 Average 1960 to 1969 Average 970 to
Step by Step Solution
There are 3 Steps involved in it
Step: 1

Get Instant Access to Expert-Tailored Solutions
See step-by-step solutions with expert insights and AI powered tools for academic success
Step: 2

Step: 3
Ace Your Homework with AI
Get the answers you need in no time with our AI-driven, step-by-step assistance
Get Started
Fundamentals of Multinational Finance
Authors: Michael H. Moffett, Arthur I. Stonehill, David K. Eiteman
5th edition
205989756, 978-0205989751