

Question
Problem 9-24 Ratio Analysis Use the following statements for Allendale Company from problem 9-17 to calculate the following ratios for 2019 and 2018(Not all ratios
Problem 9-24 Ratio Analysis
Use the following statements for Allendale Company from problem 9-17 to calculate the following ratios for 2019 and 2018(Not all ratios for 2018 will be solvable due to not having specific information from 2017) I am confused and need help on calculating the following ratios:
Debt to equity ratio
Number of times interest was earned
Plant assets to long term debt
Turnover of assets
Return on equity
Earnings per share
Book value per share of common stock
Price earnings ratio(market price per share: $11.75 in 2018. $12.50 for 2019)
Dividend yield on common stock
Below is the balance sheets and statements for 2019 and 2018.
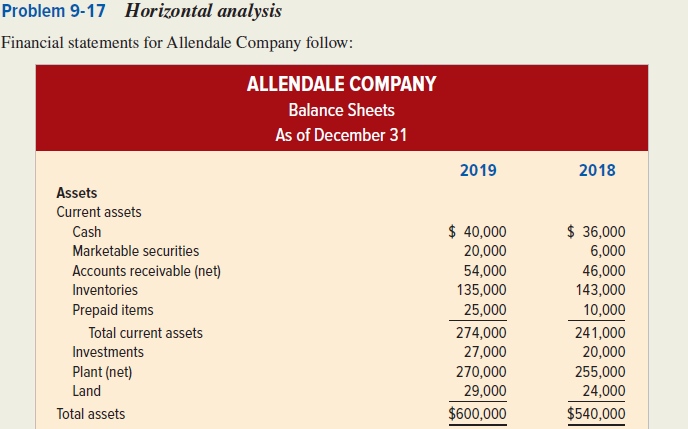
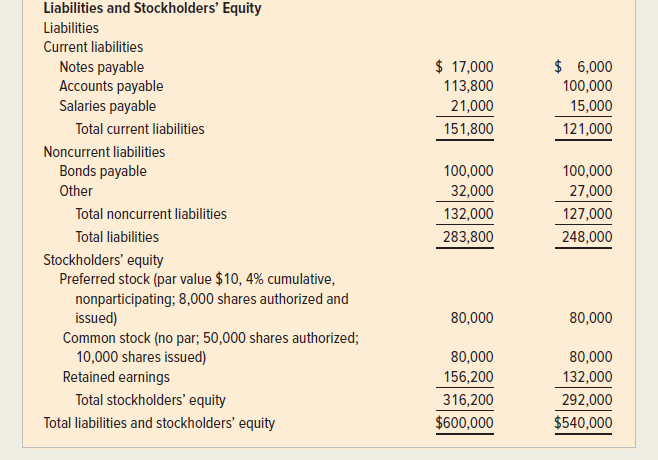
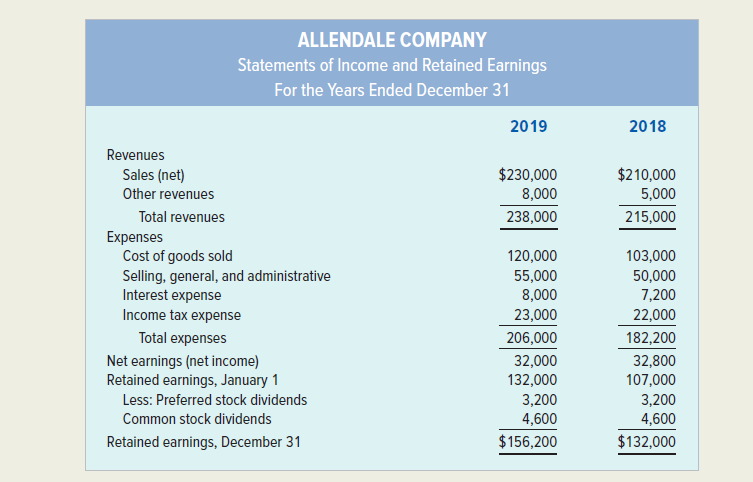
Problem 9-17 Horizontal analysis Financial statements for Allendale Company follow: ALLENDALE COMPANY Balance Sheets As of December 31 2019 2018 Assets Current assets Cash Marketable securities Accounts receivable (net) Inventories Prepaid items Total current assets Investments Plant (net) Land Total assets $ 40,000 20,000 54,000 135,000 25,000 274,000 27,000 270,000 29,000 $600,000 $ 36,000 6,000 46,000 143,000 10,000 241,000 20,000 255,000 24,000 $540,000 $ 17,000 113,800 21,000 151,800 $ 6,000 100,000 15,000 121,000 Liabilities and Stockholders' Equity Liabilities Current liabilities Notes payable Accounts payable Salaries payable Total current liabilities Noncurrent liabilities Bonds payable Other Total noncurrent liabilities Total liabilities Stockholders' equity Preferred stock (par value $10,4% cumulative, nonparticipating; 8,000 shares authorized and issued) Common stock (no par; 50,000 shares authorized; 10,000 shares issued) Retained earnings Total stockholders' equity Total liabilities and stockholders' equity 100,000 32,000 132,000 283,800 100,000 27,000 127,000 248,000 80,000 80,000 80,000 156,200 316,200 $600,000 80,000 132,000 292,000 $540,000 ALLENDALE COMPANY Statements of Income and Retained Earnings For the Years Ended December 31 2019 2018 $230,000 8,000 238,000 $210,000 5,000 215,000 Revenues Sales (net) Other revenues Total revenues Expenses Cost of goods sold Selling, general, and administrative Interest expense Income tax expense Total expenses Net earnings (net income) Retained earnings, January 1 Less: Preferred stock dividends Common stock dividends Retained earnings, December 31 120,000 55,000 8,000 23,000 206,000 32,000 132,000 3,200 4,600 $156,200 103,000 50,000 7,200 22,000 182,200 32,800 107,000 3,200 4,600 $132,000
Step by Step Solution
There are 3 Steps involved in it
Step: 1

Get Instant Access to Expert-Tailored Solutions
See step-by-step solutions with expert insights and AI powered tools for academic success
Step: 2

Step: 3
Ace Your Homework with AI
Get the answers you need in no time with our AI-driven, step-by-step assistance
Get Started
Financial Accounting For Executives And MBAs
Authors: Ferris & Wallace
2nd Edition
1934319627, 978-1934319628