Answered step by step
Verified Expert Solution
Question
1 Approved Answer
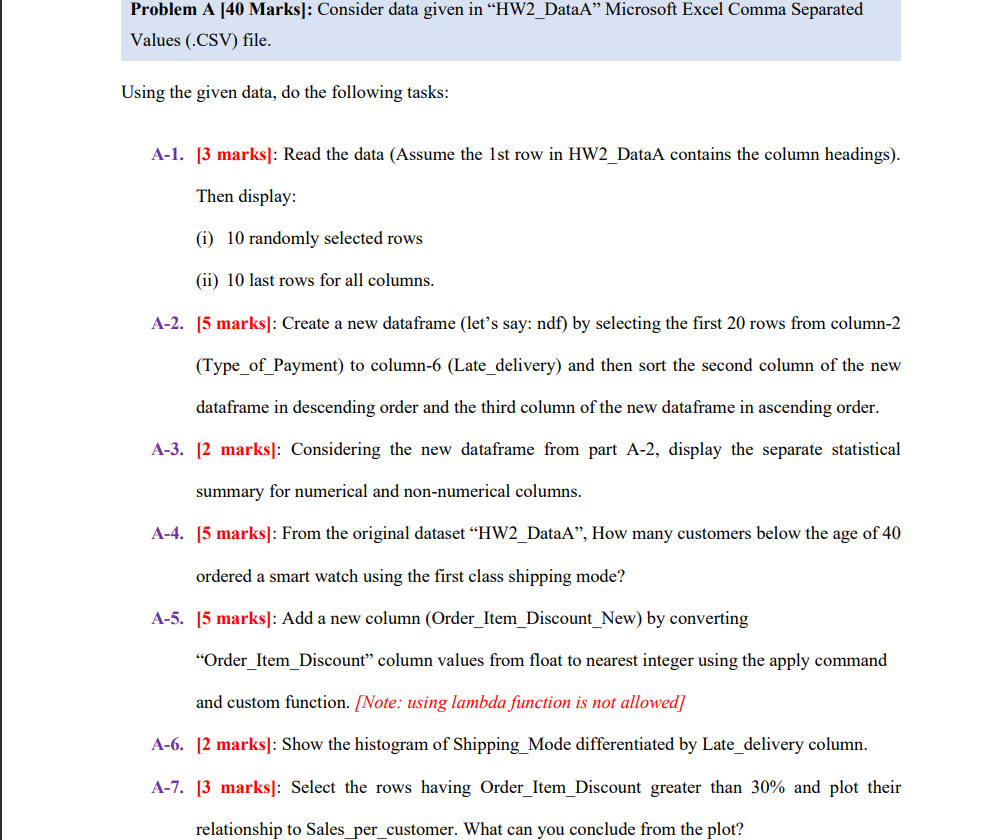
Problem A [40 Marks]: Consider data given in HW2_DataA Microsoft Excel Comma Separated Values (.CSV) file. Using the given data, do the following tasks: A-1.


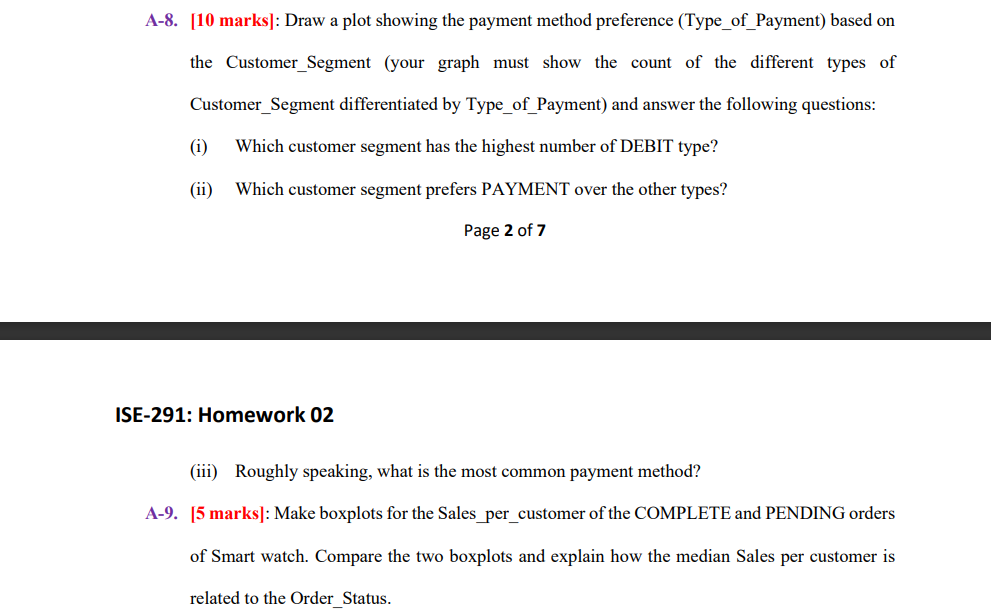
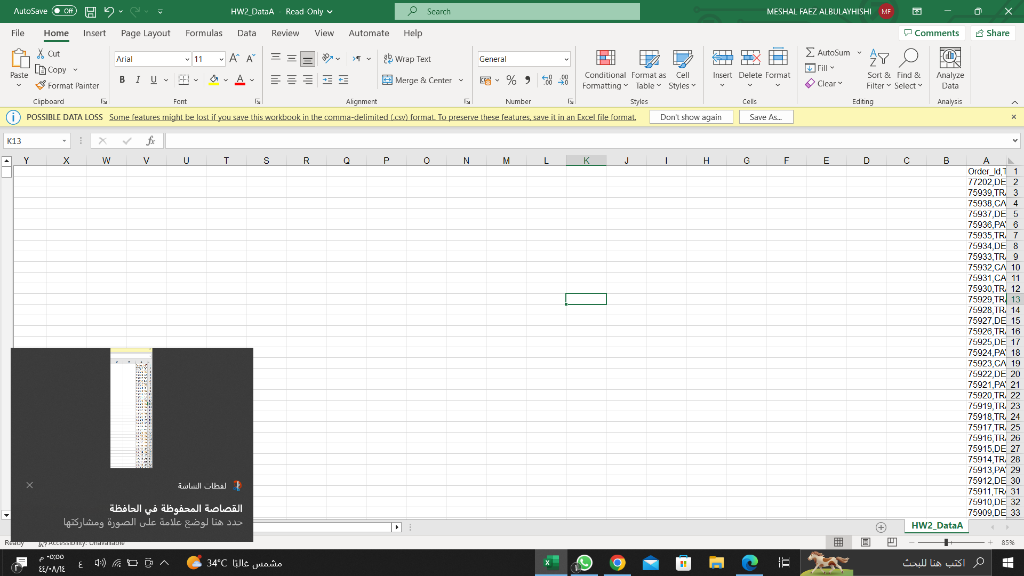
Problem A [40 Marks]: Consider data given in "HW2_DataA" Microsoft Excel Comma Separated Values (.CSV) file. Using the given data, do the following tasks: A-1. [3 marks]: Read the data (Assume the 1st row in HW2_DataA contains the column headings). Then display: (i) 10 randomly selected rows (ii) 10 last rows for all columns. A-2. [5 marks]: Create a new dataframe (let's say: ndf) by selecting the first 20 rows from column-2 (Type_of_Payment) to column-6 (Late_delivery) and then sort the second column of the new dataframe in descending order and the third column of the new dataframe in ascending order. A-3. [2 marks]: Considering the new dataframe from part A-2, display the separate statistical summary for numerical and non-numerical columns. A-4. [5 marks]: From the original dataset "HW2_DataA", How many customers below the age of 40 ordered a smart watch using the first class shipping mode? A-5. [5 marks]: Add a new column (Order_Item_Discount_New) by converting "Order_Item_Discount" column values from float to nearest integer using the apply command and custom function. [Note: using lambda function is not allowed] A-6. [2 marks]: Show the histogram of Shipping_Mode differentiated by Late_delivery column. A-7. [3 marks]: Select the rows having Order_Item_Discount greater than 30% and plot their A-8. [10 marks]: Draw a plot showing the payment method preference (Type_of_Payment) based on the Customer_Segment (your graph must show the count of the different types of Customer_Segment differentiated by Type_of_Payment) and answer the following questions: (i) Which customer segment has the highest number of DEBIT type? (ii) Which customer segment prefers PAYMENT over the other types? Page 2 of 7 291: Homework 02 (iii) Roughly speaking, what is the most common payment method? A-9. [5 marks]: Make boxplots for the Sales_per_customer of the COMPLETE and PENDING orders of Smart watch. Compare the two boxplots and explain how the median Sales per customer is related to the Order_Status
Step by Step Solution
There are 3 Steps involved in it
Step: 1

Get Instant Access to Expert-Tailored Solutions
See step-by-step solutions with expert insights and AI powered tools for academic success
Step: 2

Step: 3

Ace Your Homework with AI
Get the answers you need in no time with our AI-driven, step-by-step assistance
Get Started


