

Question: Problem #B 50 marks Consider the following data related to the final scores of the four sections of a data science course Section Scores Clytherin:
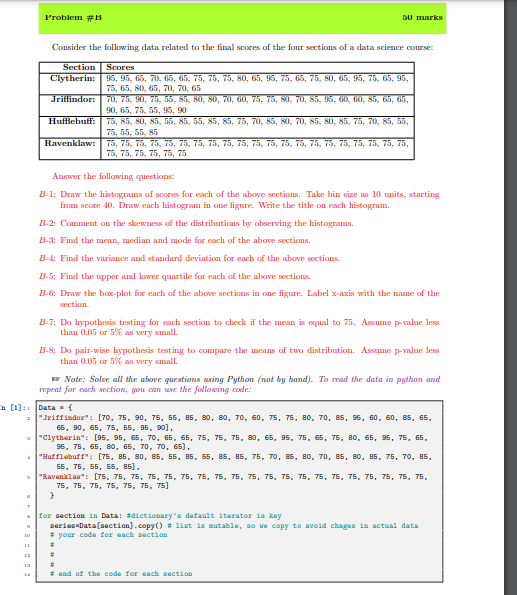
Problem #B 50 marks Consider the following data related to the final scores of the four sections of a data science course Section Scores Clytherin: 95, 95, 65, 70, 65, 65, 75, 75, 75, SO, 65, 95, 75, 65, 75, 50, 65, 95, 75, 65, 95, 75, 65, 80, 65, 70, 70,65 Jriffindor: 70, 75, 90, 75, 55, 55, 50, 60, 70, 60, 75, 75, 80, 70, 85, 95, 60, 60, 55, 65, 65, 90, 65, 75, 55, 95, 90 Hull buff: 75, 85, 80, 85, 55, 55, 55, 85, 85, 75, 70, 85, 80, 70, 85, 80, 85, 75, 70, 85, 55, 75, 55, 55, 85 Ravenklaw: 75, 75, 75, 75, 75, 75, 75, 75, 75, 75, 75, 75, 75, 75, 75, 75, 75, 75, 75, 75, 75, 75, 75, 75, 75, 75, 75 Answer the following questions: B-1: Draw the histogruns of scores for each of the above sections. Take bin size is 10 units, starting from score 40. Draw each histogram in one figure. Write the title on each histogram. B-2: Comment on the skewness of the distributions by obeerving the histograms. B-3: Find the mean, median and mode for each of the above sections. B-4: Find the variance and standard deviation for each of the above sections B-5: Find the upper and lower quartile for each of the above sections. B-6: Draw the box-plot for each of the above sections in one figure. Label 3-axis with the name of the section B-7: Do hypothesis testing for each section to check if the mean is equal to 75. Assume p-value less than 0.05 or 5% a very small B-8: Do pair-wise hypothesis testing to compare the means of two distribution. Assume p-value less than 0.05 or 5% a very small Note: Solec all the above questions using Python (not by hand). To read the data in python and repeat for each section, you can use the following code: n (1): 1 Data Jriffindor": [70, 75, 90, 75, 55, 85, 80, 80, 70, 60, 75, 75, 80, 70, 85, 95, 60, 60, 85, 65. 65, 90, 65, 75, 55, 95, 90). "clytherin": [95, 95, 65, 70, 65, 65, 75, 75, 75, 80, 65, 95, 75, 65, 75, 80, 65, 95, 75, 65. 95, 75, 65, 80, 65, 70, 70, 65). "Hufflepuff": [75, B5, 80, E5, E5, B5, B5, B5, B5, T2, T3, B5, B2, 70, 85, 80, B5, 75, 73, B5, 55, 75, 55, 55, 85). "Ravenklas": [75, 75, 75, 75, 75, 75, 75, 75, 75, 75, 75, 75, 75, 75, 75, 75, 75, 75, 75, 75. 75, 75, 75, 75, 75, 75, 75] ) for section in Data: dictionary's default iterator is key series-Data[section).copy() # list is mutable, so we copy to avoid chages in actual data #your code for each section # # end of the code for each section Problem #B 50 marks Consider the following data related to the final scores of the four sections of a data science course Section Scores Clytherin: 95, 95, 65, 70, 65, 65, 75, 75, 75, SO, 65, 95, 75, 65, 75, 50, 65, 95, 75, 65, 95, 75, 65, 80, 65, 70, 70,65 Jriffindor: 70, 75, 90, 75, 55, 55, 50, 60, 70, 60, 75, 75, 80, 70, 85, 95, 60, 60, 55, 65, 65, 90, 65, 75, 55, 95, 90 Hull buff: 75, 85, 80, 85, 55, 55, 55, 85, 85, 75, 70, 85, 80, 70, 85, 80, 85, 75, 70, 85, 55, 75, 55, 55, 85 Ravenklaw: 75, 75, 75, 75, 75, 75, 75, 75, 75, 75, 75, 75, 75, 75, 75, 75, 75, 75, 75, 75, 75, 75, 75, 75, 75, 75, 75 Answer the following questions: B-1: Draw the histogruns of scores for each of the above sections. Take bin size is 10 units, starting from score 40. Draw each histogram in one figure. Write the title on each histogram. B-2: Comment on the skewness of the distributions by obeerving the histograms. B-3: Find the mean, median and mode for each of the above sections. B-4: Find the variance and standard deviation for each of the above sections B-5: Find the upper and lower quartile for each of the above sections. B-6: Draw the box-plot for each of the above sections in one figure. Label 3-axis with the name of the section B-7: Do hypothesis testing for each section to check if the mean is equal to 75. Assume p-value less than 0.05 or 5% a very small B-8: Do pair-wise hypothesis testing to compare the means of two distribution. Assume p-value less than 0.05 or 5% a very small Note: Solec all the above questions using Python (not by hand). To read the data in python and repeat for each section, you can use the following code: n (1): 1 Data Jriffindor": [70, 75, 90, 75, 55, 85, 80, 80, 70, 60, 75, 75, 80, 70, 85, 95, 60, 60, 85, 65. 65, 90, 65, 75, 55, 95, 90). "clytherin": [95, 95, 65, 70, 65, 65, 75, 75, 75, 80, 65, 95, 75, 65, 75, 80, 65, 95, 75, 65. 95, 75, 65, 80, 65, 70, 70, 65). "Hufflepuff": [75, B5, 80, E5, E5, B5, B5, B5, B5, T2, T3, B5, B2, 70, 85, 80, B5, 75, 73, B5, 55, 75, 55, 55, 85). "Ravenklas": [75, 75, 75, 75, 75, 75, 75, 75, 75, 75, 75, 75, 75, 75, 75, 75, 75, 75, 75, 75. 75, 75, 75, 75, 75, 75, 75] ) for section in Data: dictionary's default iterator is key series-Data[section).copy() # list is mutable, so we copy to avoid chages in actual data #your code for each section # # end of the code for each
Step by Step Solution
There are 3 Steps involved in it

Get step-by-step solutions from verified subject matter experts