Problem B:
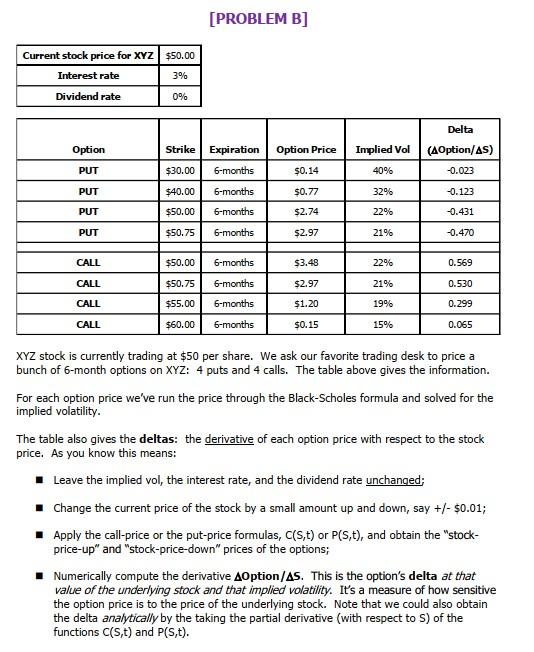
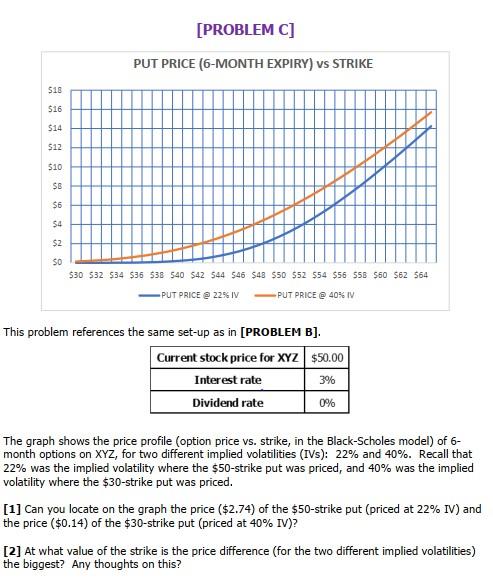
[PROBLEM C] PUT PRICE (6-MONTH EXPIRY) vs STRIKE $18 $16 514 $12 $10 SB $6 $4 $2 SO $30 532 534 $36 538 540 542 544 $46 $43 $50 $52 554 $56 555 $50 $62 564 PUT PRICE @ 2256 IV PUT PRICE @ 40% IV This problem references the same set-up as in [PROBLEM B]. Current stock price for XYZ $50.00 Interest rate 3% Dividend rate 0% The graph shows the price profile (option price vs. strike, in the Black-Scholes model) of 6- month options on XYZ, for two different implied volatilities (IVs): 22% and 40%. Recall that 22% was the implied volatility where the $50-strike put was priced, and 40% was the implied volatility where the $30-strike put was priced. [1] Can you locate on the graph the price ($2.74) of the $50-strike put (priced at 22% IV) and the price ($0.14) of the $30-strike put (priced at 40% IV)? [2] At what value of the strike is the price difference (for the two different implied volatilities) the biggest? Any thoughts on this? [PROBLEM B] Current stock price for XYZ $50.00 Interest rate 3% Dividend rate 0% Delta (AOption/AS) Option Option Price Implied Vol 40% PUT $0.14 -0.023 Strike Expiration $30.00 6-months $40.00 6-months $50.00 6-months PUT $0.77 32% -0.123 PUT $2.74 22% -0.431 PUT $50.75 6-months $2.97 21% -0.470 CALL $50.00 6-months $3.48 22% 0.569 CALL $50.75 6-months $2.97 21% 0.530 CALL $55.00 6-months $1.20 19% 0.299 CALL $60.00 6-months $0.15 15% 0.065 XYZ stock is currently trading at $50 per share. We ask our favorite trading desk to price a bunch of 6-month options on XYZ: 4 puts and 4 calls. The table above gives the information. For each option price we've run the price through the Black-Scholes formula and solved for the implied volatility. The table also gives the deltas: the derivative of each option price with respect to the stock price. As you know this means: Leave the implied vol, the interest rate, and the dividend rate unchanged Change the current price of the stock by a small amount up and down, say +/- $0.01; Apply the call-price or the put-price formulas, C(s, t) or PCs,t), and obtain the "stock- price-up" and "stock-price-down" prices of the options; Numerically compute the derivative AOption/As. This is the option's delta at that value of the underlying stock and that implied volatility. It's a measure of how sensitive the option price is to the price of the underlying stock. Note that we could also obtain the delta analytically by the taking the partial derivative (with respect to S) of the functions C(s, t) and P(S,t). [PROBLEM C] PUT PRICE (6-MONTH EXPIRY) vs STRIKE $18 $16 514 $12 $10 SB $6 $4 $2 SO $30 532 534 $36 538 540 542 544 $46 $43 $50 $52 554 $56 555 $50 $62 564 PUT PRICE @ 2256 IV PUT PRICE @ 40% IV This problem references the same set-up as in [PROBLEM B]. Current stock price for XYZ $50.00 Interest rate 3% Dividend rate 0% The graph shows the price profile (option price vs. strike, in the Black-Scholes model) of 6- month options on XYZ, for two different implied volatilities (IVs): 22% and 40%. Recall that 22% was the implied volatility where the $50-strike put was priced, and 40% was the implied volatility where the $30-strike put was priced. [1] Can you locate on the graph the price ($2.74) of the $50-strike put (priced at 22% IV) and the price ($0.14) of the $30-strike put (priced at 40% IV)? [2] At what value of the strike is the price difference (for the two different implied volatilities) the biggest? Any thoughts on this? [PROBLEM B] Current stock price for XYZ $50.00 Interest rate 3% Dividend rate 0% Delta (AOption/AS) Option Option Price Implied Vol 40% PUT $0.14 -0.023 Strike Expiration $30.00 6-months $40.00 6-months $50.00 6-months PUT $0.77 32% -0.123 PUT $2.74 22% -0.431 PUT $50.75 6-months $2.97 21% -0.470 CALL $50.00 6-months $3.48 22% 0.569 CALL $50.75 6-months $2.97 21% 0.530 CALL $55.00 6-months $1.20 19% 0.299 CALL $60.00 6-months $0.15 15% 0.065 XYZ stock is currently trading at $50 per share. We ask our favorite trading desk to price a bunch of 6-month options on XYZ: 4 puts and 4 calls. The table above gives the information. For each option price we've run the price through the Black-Scholes formula and solved for the implied volatility. The table also gives the deltas: the derivative of each option price with respect to the stock price. As you know this means: Leave the implied vol, the interest rate, and the dividend rate unchanged Change the current price of the stock by a small amount up and down, say +/- $0.01; Apply the call-price or the put-price formulas, C(s, t) or PCs,t), and obtain the "stock- price-up" and "stock-price-down" prices of the options; Numerically compute the derivative AOption/As. This is the option's delta at that value of the underlying stock and that implied volatility. It's a measure of how sensitive the option price is to the price of the underlying stock. Note that we could also obtain the delta analytically by the taking the partial derivative (with respect to S) of the functions C(s, t) and P(S,t)