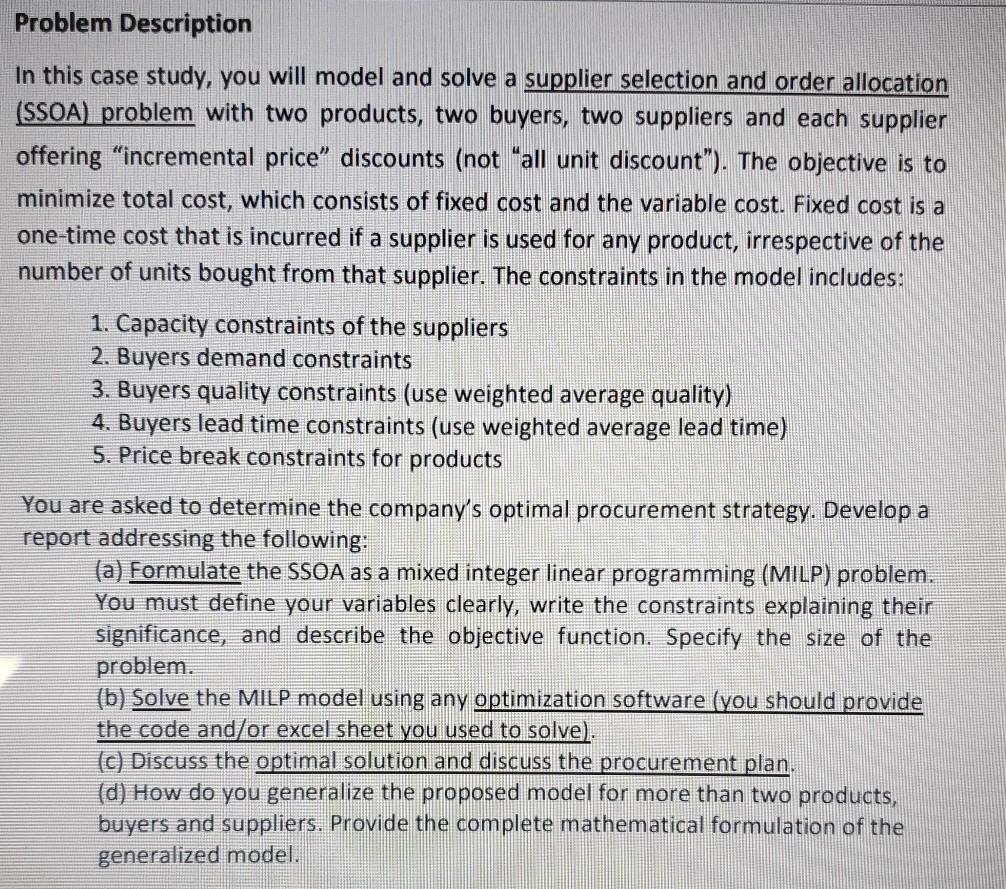
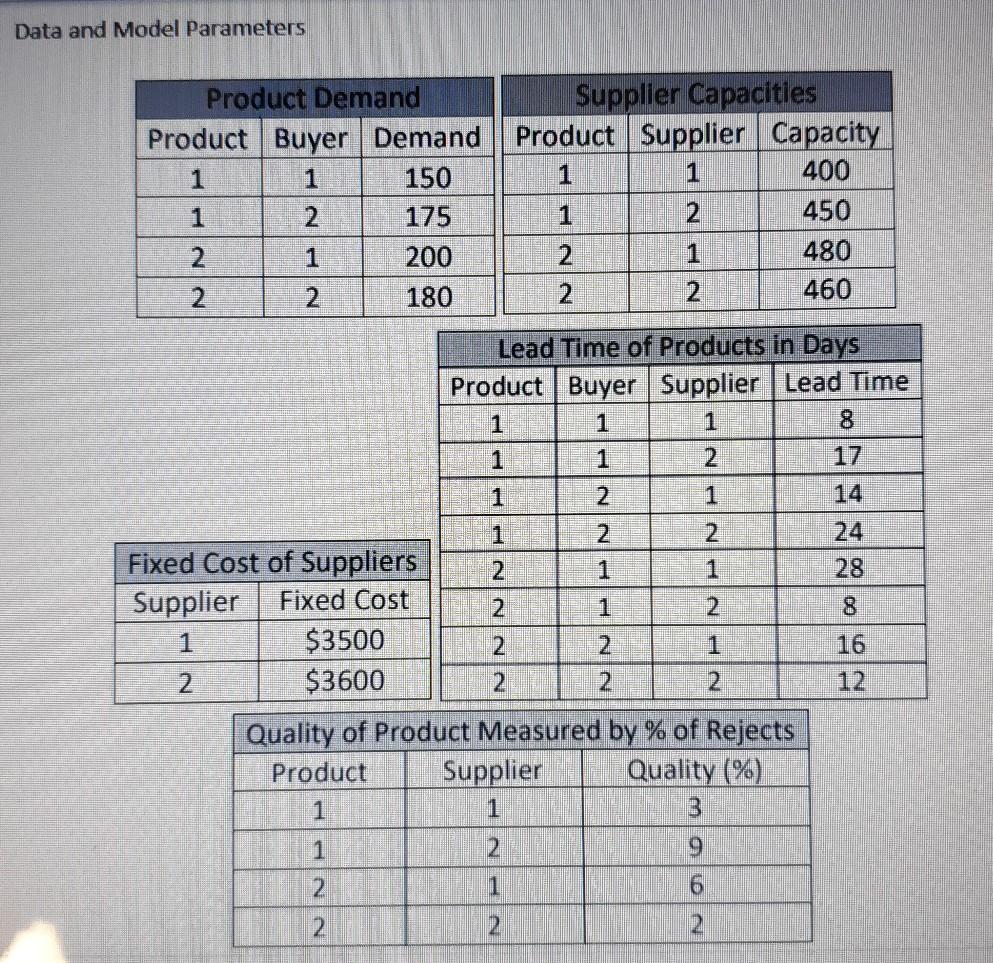
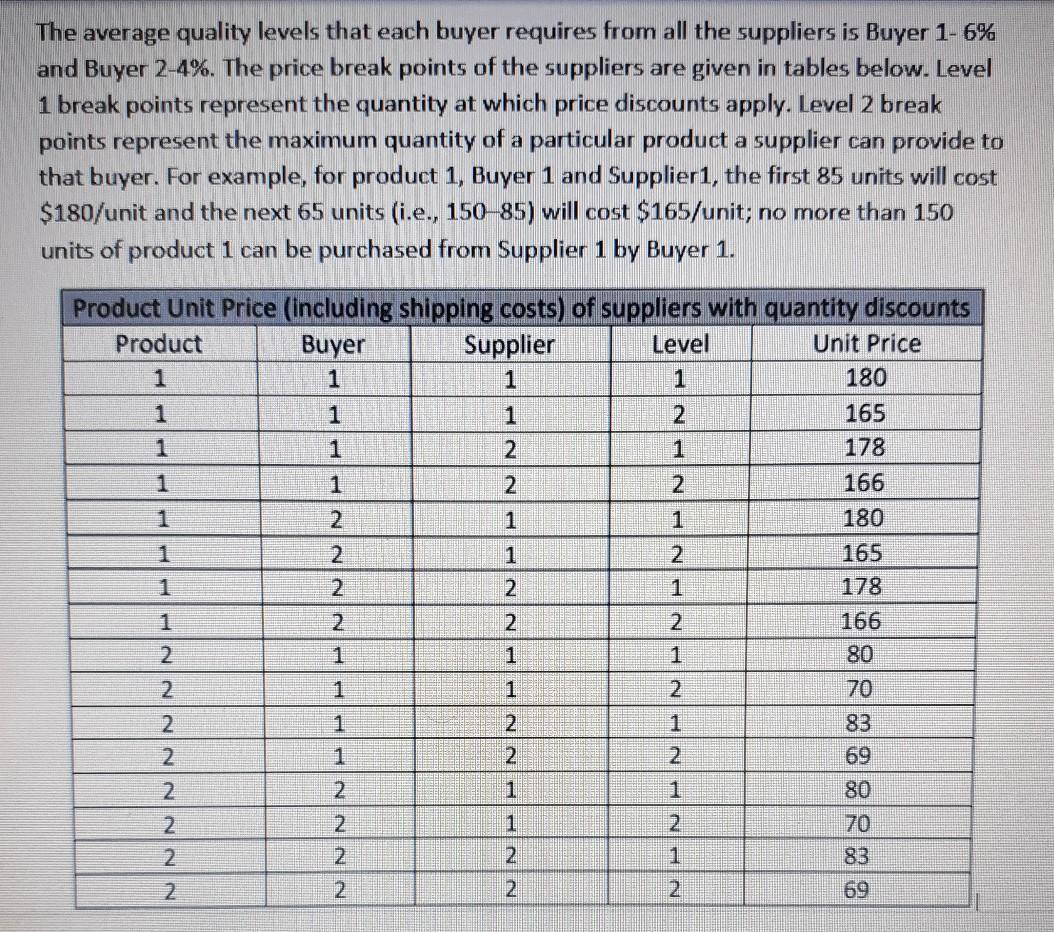
Problem Description In this case study, you will model and solve a supplier selection and order allocation (SSOA) problem with two products, two buyers, two suppliers and each supplier offering "incremental price discounts (not "all unit discount"). The objective is to minimize total cost, which consists of fixed cost and the variable cost. Fixed cost is a one-time cost that is incurred if a supplier is used for any product, irrespective of the number of units bought from that supplier. The constraints in the model includes: 1. Capacity constraints of the suppliers 2. Buyers demand constraints 3. Buyers quality constraints (use weighted average quality) 4. Buyers lead time constraints (use weighted average lead time) 5. Price break constraints for products You are asked to determine the company's optimal procurement strategy. Develop a report addressing the following: (a) Formulate the SSOA as a mixed integer linear programming (MILP) problem. You must define your variables clearly, write the constraints explaining their significance, and describe the objective function. Specify the size of the problem. (b) Solve the MILP model using any optimization software (you should provide the code and/or excel sheet you used to solve), (c) Discuss the optimal solution and discuss the procurement plan. (d) How do you generalize the proposed model for more than two products, buyers and suppliers. Provide the complete mathematical formulation of the generalized model. Data and Model Parameters Product Demand Product Buyer Demand 1 150 1 2 175 2 1 200 2 180 Supplier Capacities Product Supplier Capacity 1 1 400 1 450 2 480 2 2 460 Lead Time of Products in Days Product Buyer Supplier Lead Time 1 1 1 1 14 24 HIN NENHN 2 2 Fixed Cost of Suppliers 2 1 1 Supplier Fixed Cost 2 $3500 2 2 1 $3600 2 2 Quality of Product Measured by % of Rejects Product Supplier Quality (%) 1 28 Nla. 1 9 2 1 6 2 2 The average quality levels that each buyer requires from all the suppliers is Buyer 1-6% and Buyer 2-4%. The price break points of the suppliers are given in tables below. Level 1 break points represent the quantity at which price discounts apply. Level 2 break points represent the maximum quantity of a particular product a supplier can provide to that buyer. For example, for product 1, Buyer 1 and Suppliers, the first 85 units will cost $180/unit and the next 65 units (i.e., 15085) will cost $165/unit; no more than 150 units of product 1 can be purchased from Supplier 1 by Buyer 1. Product Unit Price (including shipping costs) of suppliers with quantity discounts Product Buyer Supplier Level Unit Price 1 1 1 180 2 165 2. 178 1 2 2 166 1 1 180 2 1 2 165 2 2 1 178 1 2. 2 2 166 2 1 1 80 2. 1 1 2 70 2 1 2 1 83 2 2 22 69 2 1 80 2 1 2 70 2 2 1 83 2 2 69 ENNHENNHENNE INDINN Price Break Points by Suppliers Product Buyer Supplier Level Break Point 1 1 1 85 1 1 1 2 150 1 2 1 95 1 2 2 175 2 1 85 2. 1 2 150 1 2. 2 1 95 175 1 120 2. 1 170 2 1 2 125 2 2 160 2 2 1 1 120 2 1 2 170 2 1 125 2 160 NNN NINI Average Lead Time (in days) Requirements of the Buyers Product Buyer Lead Time 1 1 1 2 19 2 2. 2 Problem Description In this case study, you will model and solve a supplier selection and order allocation (SSOA) problem with two products, two buyers, two suppliers and each supplier offering "incremental price discounts (not "all unit discount"). The objective is to minimize total cost, which consists of fixed cost and the variable cost. Fixed cost is a one-time cost that is incurred if a supplier is used for any product, irrespective of the number of units bought from that supplier. The constraints in the model includes: 1. Capacity constraints of the suppliers 2. Buyers demand constraints 3. Buyers quality constraints (use weighted average quality) 4. Buyers lead time constraints (use weighted average lead time) 5. Price break constraints for products You are asked to determine the company's optimal procurement strategy. Develop a report addressing the following: (a) Formulate the SSOA as a mixed integer linear programming (MILP) problem. You must define your variables clearly, write the constraints explaining their significance, and describe the objective function. Specify the size of the problem. (b) Solve the MILP model using any optimization software (you should provide the code and/or excel sheet you used to solve), (c) Discuss the optimal solution and discuss the procurement plan. (d) How do you generalize the proposed model for more than two products, buyers and suppliers. Provide the complete mathematical formulation of the generalized model. Data and Model Parameters Product Demand Product Buyer Demand 1 150 1 2 175 2 1 200 2 180 Supplier Capacities Product Supplier Capacity 1 1 400 1 450 2 480 2 2 460 Lead Time of Products in Days Product Buyer Supplier Lead Time 1 1 1 1 14 24 HIN NENHN 2 2 Fixed Cost of Suppliers 2 1 1 Supplier Fixed Cost 2 $3500 2 2 1 $3600 2 2 Quality of Product Measured by % of Rejects Product Supplier Quality (%) 1 28 Nla. 1 9 2 1 6 2 2 The average quality levels that each buyer requires from all the suppliers is Buyer 1-6% and Buyer 2-4%. The price break points of the suppliers are given in tables below. Level 1 break points represent the quantity at which price discounts apply. Level 2 break points represent the maximum quantity of a particular product a supplier can provide to that buyer. For example, for product 1, Buyer 1 and Suppliers, the first 85 units will cost $180/unit and the next 65 units (i.e., 15085) will cost $165/unit; no more than 150 units of product 1 can be purchased from Supplier 1 by Buyer 1. Product Unit Price (including shipping costs) of suppliers with quantity discounts Product Buyer Supplier Level Unit Price 1 1 1 180 2 165 2. 178 1 2 2 166 1 1 180 2 1 2 165 2 2 1 178 1 2. 2 2 166 2 1 1 80 2. 1 1 2 70 2 1 2 1 83 2 2 22 69 2 1 80 2 1 2 70 2 2 1 83 2 2 69 ENNHENNHENNE INDINN Price Break Points by Suppliers Product Buyer Supplier Level Break Point 1 1 1 85 1 1 1 2 150 1 2 1 95 1 2 2 175 2 1 85 2. 1 2 150 1 2. 2 1 95 175 1 120 2. 1 170 2 1 2 125 2 2 160 2 2 1 1 120 2 1 2 170 2 1 125 2 160 NNN NINI Average Lead Time (in days) Requirements of the Buyers Product Buyer Lead Time 1 1 1 2 19 2 2. 2