

Answered step by step
Verified Expert Solution
Question
1 Approved Answer
problem exapmples everything is included 1. A reliability test of 7 samples was run until all samples had failed. As each sample failed, it was
problem 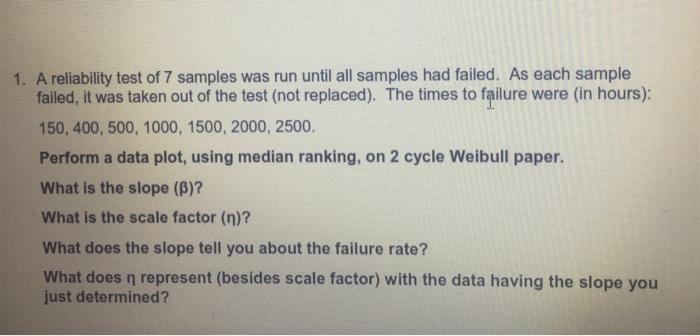
exapmples


everything is included
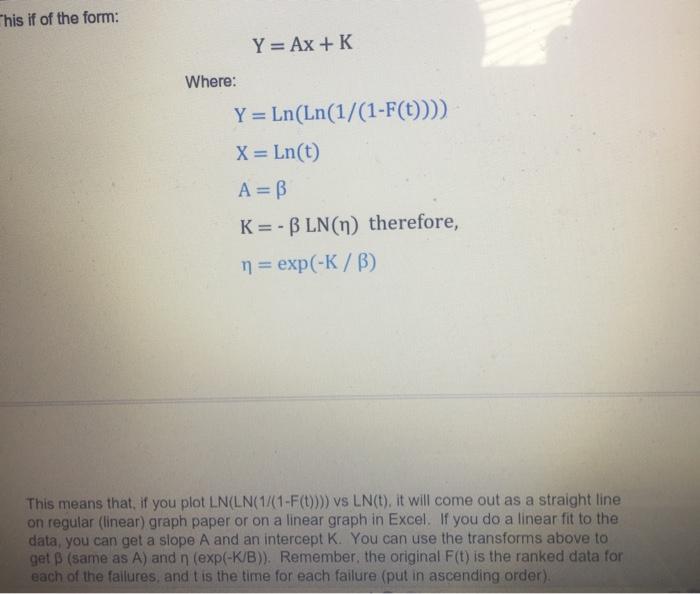
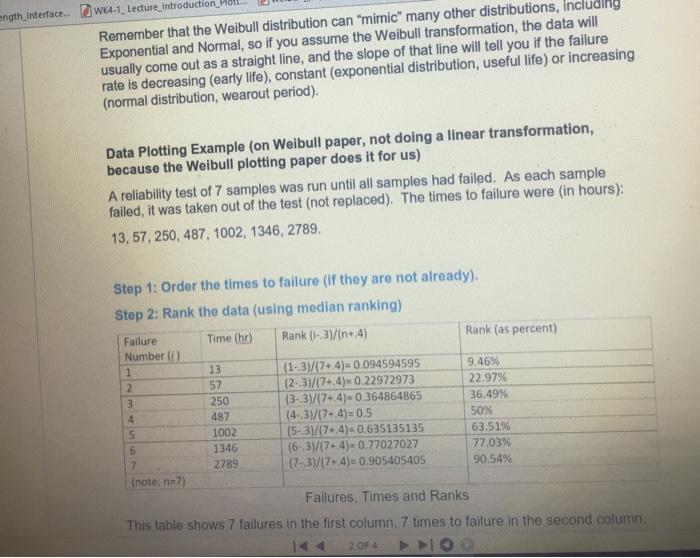
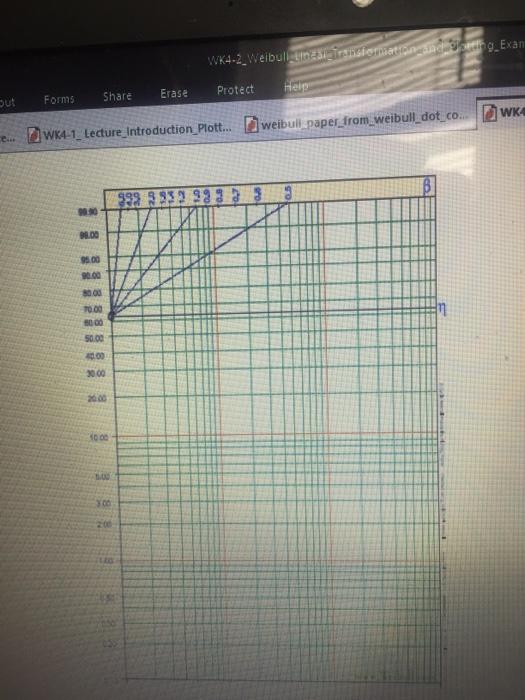
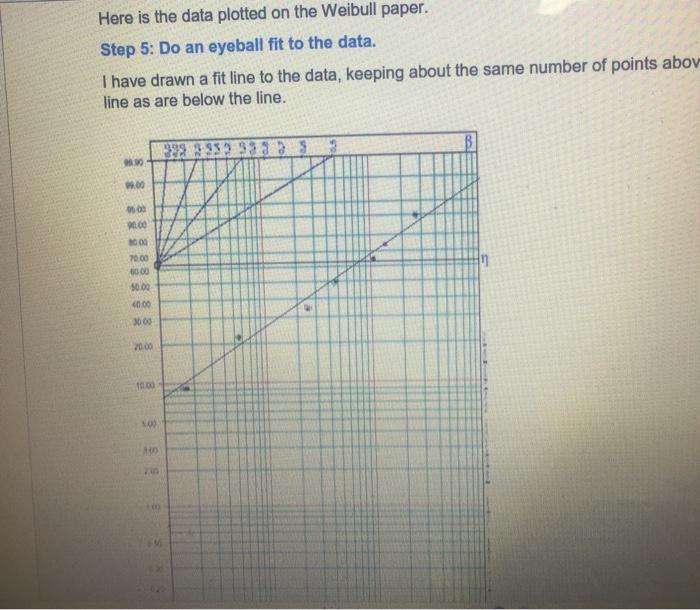
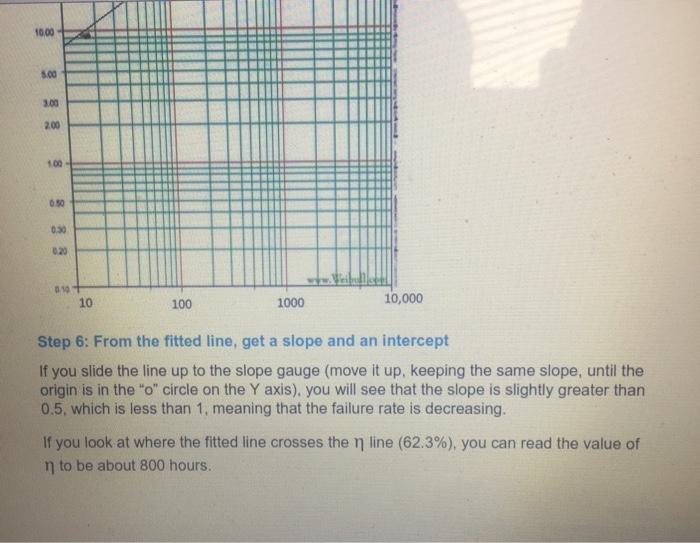
1. A reliability test of 7 samples was run until all samples had failed. As each sample failed, it was taken out of the test (not replaced). The times to failure were in hours): 150, 400, 500, 1000, 1500, 2000, 2500. Perform a data plot, using median ranking, on 2 cycle Weibull paper. What is the slope (B)? What is the scale factor (n)? What does the slope tell you about the failure rate? What does n represent (besides scale factor) with the data having the slope you just determined? The Weibull Linear Transformation The CDF for the Weibull distribution is: F(t) = 1- exp [-(t) B] (Note that exp [x] means the same thing as ex) Let's transform this equation so that it plots in a straight line on regular graph paper. First, let's calculate 1-F(t): 1-F(t) =1-{1- exp [-(t) B]}= exp [-(t) B] Now, take the natural log (LN) of both sides: LN(1-F(t)) = -(t) Since the LN(x) = - LN (1/x), then: LN(1/(1-F(t))) = (t) B To get rid of the power on the right side of the equation, take the LN of both sides again (note also that LN(Un) = LN(t)-LN(n): LN(LN(1/(1-F(t)))) = B(LN(t)-LN (n)) LN(LN(1/(1-F(t)))) = BLN(t) - BLN(m) This if of the form: Y=Ax +K Where: Y = Ln(Ln(1/(1-F(t)))) X = Ln(t) A=B K=-BLN(n) therefore, n = exp(-K/B) This means that if you plot LN(LN(1/(1-F(t)))) vs LN(t), it will come out as a straight line on regular (linear) graph paper or on a linear graph in Excel. If you do a linear fit to the data, you can get a slope A and an intercept K. You can use the transforms above to get (same as A) and n (exp(-K/B)). Remember, the original F(t) is the ranked data for each of the failures, and tis the time for each failure (put in ascending order) ength_nterface... wx4-1_Lecture_Introduction Remember that the Weibull distribution can "mimic" many other distributions, Exponential and Normal, so if you assume the Weibull transformation, the data will usually come out as a straight line, and the slope of that line will tell you if the failure rate is decreasing (early life), constant (exponential distribution, useful life) or increasing (normal distribution, wearout period). Data Plotting Example (on Weibull paper, not doing a linear transformation, because the Weibull plotting paper does it for us) A reliability test of 7 samples was run until all samples had failed. As each sample failed, it was taken out of the test (not replaced). The times to failure were in hours): 13,57, 250, 487, 1002, 1346, 2789. Step 1: Order the times to failure (if they are not already). Step 2: Rank the data (using median ranking) Failure Time (hr) Rank (1-3)/(n.4) Rank (as percent) Number( 1 13 (1-3)/174)= 0.094594595 9.46% 2 57 (2:3)/(7+4)*0.22972973 22.9794 3 250 (3-3)/17+4)=0.364864865 36.49% 4 487 (4-3)/(7-4)=0.5 50% 5 1002 (5-3)/(744)= 0.635135135 63.5196 1346 (6-3/17-4)-0.77027027 77.03% 7 2789 (7-3)/17-4)=0.905405405 90.54% (note: n=7) Failures, Times and Ranks This table shows 7 failures in the first column, 7 times to failure in the second column 2 OF 4 6 Step 3: Censor the data in some special cases No censoring required. We are not interested in different classes of failures, only the fact that failures have occurred. Step 4: Plot the data on special plotting paper, or do a linear transformation on the data, In this case, we will first plot the data on Weibull plotting paper. We are assuming that a Weibull distribution will most likely plot as a straight line on Weibull plotting paper. We will plot the time (column 2) on the X axis, versus the Rank (column 4) on the Y axis. We will do the linear transformation option later. There are different types of Weibull plotting paper. The one shown here can be downloaded from Weibull.com, in 1.2.3 and 4 log cycle X axis format. The one shown here is 3 cycle, and can plot, for instance, X axis values from 10 to 10,000. It will do for our X axis values ranging from 13 to 2789. WK4-2 Weibulluar simata selleg_Exam . Erase Protect Hele sut Forms Share WK e. WK4-1_ Lecture_Introduction Plott... weibull paper_from_weibull_dotcom 90.00 95.00 100 8000 TO 00 000 50.00 3000 2000 BE Here is the data plotted on the Weibull paper. Step 5: Do an eyeball fit to the data. I have drawn a fit line to the data, keeping about the same number of points abov line as are below the line. 08.00 00 20.00 C00 70.00 10.00 50.00 4000 3000 2000 10.00 10,00 5.00 3.00 200 100 0.50 10+ 10 100 1000 10,000 Step 6: From the fitted line, get a slope and an intercept If you slide the line up to the slope gauge (move it up, keeping the same slope, until the origin is in the "o" circle on the Y axis), you will see that the slope is slightly greater than 0.5, which is less than 1. meaning that the failure rate is decreasing. If you look at where the fitted line crosses the n line (62.3%), you can read the value of n to be about 800 hours Step by Step Solution
There are 3 Steps involved in it
Step: 1

Get Instant Access to Expert-Tailored Solutions
See step-by-step solutions with expert insights and AI powered tools for academic success
Step: 2

Step: 3
Ace Your Homework with AI
Get the answers you need in no time with our AI-driven, step-by-step assistance
Get Started
Database Driven Web Sites
Authors: Joline Morrison, Mike Morrison
2nd Edition
? 061906448X, 978-0619064488