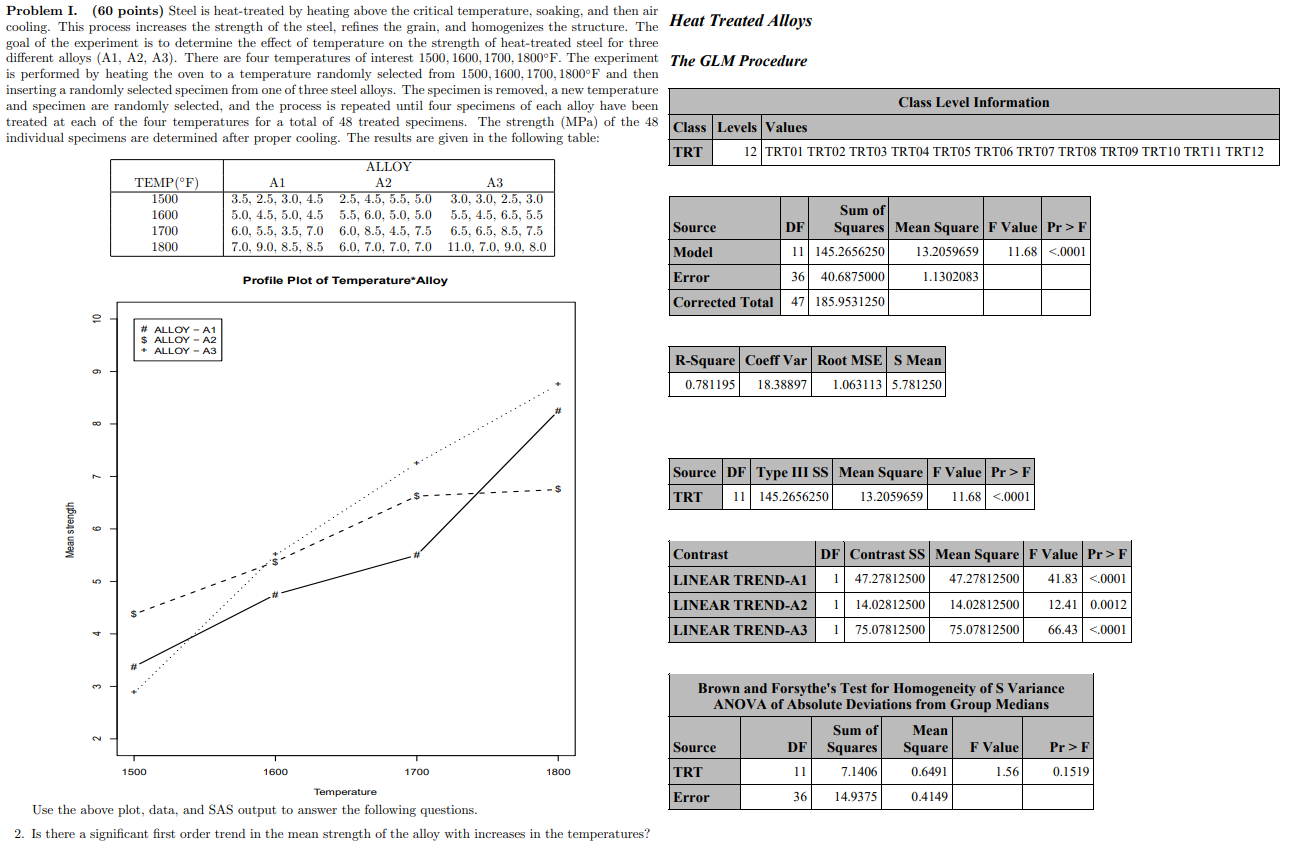
Problem I. (60 points) Steel is heat-treated by heating above the critical temperature, soaking, and then air cooling. This process increases the strength of the steel, refines the grain, and homogenizes the structure. The Heat Treated Alloys goal of the experiment is to determine the effect of temperature on the strength of heat-treated steel for three different alloys (A1, A2, A3). There are four temperatures of interest 1500, 1600, 1700, 1800 F. The experiment The GLM Procedure is performed by heating the oven to a temperature randomly selected from 1500, 1600, 1700, 1800'F and then inserting a randomly selected specimen from one of three steel alloys. The specimen is removed, a new temperature and specimen are randomly selected, and the process is repeated until four specimens of each alloy have been Class Level Information treated at each of the four temperatures for a total of 48 treated specimens. The strength (MPa) of the 48 Class Levels Values individual specimens are determined after proper cooling. The results are given in the following table: TRT 12 TRTOI TRTO2 TRTO3 TRT04 TRTO5 TRTO6 TRT07 TRTOS TRT09 TRT10 TRT1I TRT12 ALLOY TEMP (F) A1 A2 A3 1500 3.5, 2.5, 3.0, 4.5 2.5, 4.5, 5.5, 5.0 3.0, 3.0, 2.5, 3.0 1600 5.0, 4.5, 5.0, 4.5 5.5, 6.0, 5.0, 5.0 5.5, 4.5, 6.5, 5.5 Sum of 1700 6.0, 5.5, 3.5, 7.0 6.0, 8.5, 4.5, 7.5 6.5, 6.5, 8.5, 7.5 Source DF Squares | Mean Square F Value Pr > F 1800 7.0, 9.0, 8.5, 8.5 6.0, 7.0, 7.0, 7.0 11.0, 7.0, 9.0, 8.0 Model 11 145.2656250 13.2059659 11.68 <.0001 profile plot of temperature error corrected total alloy a1 a2 a3 r-square coeff var root mse s mean source df type iii ss square f value pr> F TRT 11 145.2656250 13.2059659 1 1.68 <.0001 mean strength contrast df ss square f value pr> F LINEAR TREND-A1 1 47.27812500 47.27812500 41.83 <.0001 linear trend-a2 st trend-a3 brown and forsythe test for homogeneity of s variance anova absolute deviations from group medians sum mean source df squares square f value pr> F 1500 1600 1700 1800 TRT 11 7.1406 0.6491 1.56 0.1519 Temperature Error 36 14.9375 0.4149 Use the above plot, data, and SAS output to answer the following questions. 2. Is there a significant first order trend in the mean strength of the alloy with increases in the temperatures


