

Answered step by step
Verified Expert Solution
Question
1 Approved Answer
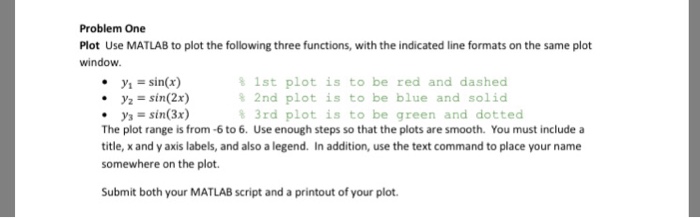
Problem One Plot Use MATLAB to plot the following three functions, with the indicated line formats on the same plot window. -sinx) % 1st plot
Step by Step Solution
There are 3 Steps involved in it
Step: 1

Get Instant Access to Expert-Tailored Solutions
See step-by-step solutions with expert insights and AI powered tools for academic success
Step: 2

Step: 3
Ace Your Homework with AI
Get the answers you need in no time with our AI-driven, step-by-step assistance
Get Started
Case Studies In Business Data Bases
Authors: James Bradley
1st Edition
0030141346, 978-0030141348