Answered step by step
Verified Expert Solution
Link Copied!

Question

1 Approved Answer

Problem Set 1: Mathematical Foundations for Economic Models Using Tables and Graphs to Explain Economic Models (WLO 1.4) 1.? ?The table below contains typical economic

Problem Set 1: Mathematical Foundations for Economic Models

Using Tables and Graphs to Explain Economic Models (WLO 1.4) 1.? ?The table below contains typical economic data. It shows the quantity of a good that is demanded by purchasers and the quantity supplied by producers at various prices. Price Quantity Demanded Quantity Supplied $100 10 25 $80 20 20 $60 30 15 $40 40 10 $20 50 5 $0 60 0 a. At which price is quantity supplied equal to 10? b. At which price is quantity demanded equal to 10? c. At which price are quantities demanded and quantities supplied the same? (?Note: This is the equilibrium price.) d. At which price is the quantity demanded ?less than? the quantity supplied? (This represents a surplus.)? ? What is the size of the surplus? (That is, how much more is supplied than demanded?) e. At a price of $20 we see that the quantity demanded is ?greater than? the quantity supplied. This represents a ?shortage?. What is the size of the shortage? (That is, how much more is demanded than supplied?)

2. Refer to the graph below, which represents typical economic information about the amount of a product demanded and supplied at various prices.

a. At what price is quantity demanded equal to 2000? b. At what price is quantity demanded equal to zero? c. At what price is quantity supplied equal to 1400? d. What is the equilibrium quantity? (Where quantity demanded and quantity supplied are equal.) e. What is the equilibrium price? (Where quantity demanded and quantity supplied are equal.)

Problem Set 1: Mathematical Foundations for Economic Models

Using Equations to Explain Economic Models (WLO 1.4) 3. Text ch 3 Prob 1. The following function describes the demand condition for a company that makes caps featuring names of college and professional teams in a variety of sports. Q ? = 2,000 - 100?P where ?Q ? is cap sales and ?P ? is price. a. How many caps could be sold at $12 each? b. What should the price be in order for the company to sell 1,000 caps? c. At what price would cap sales equal zero?

4. Text ch 3 Prob 3. The following relations describe the supply and demand for posters. Demand: ?Q ? D ? = 65,000 - 10,000?P Supply: ?Q ? s ? = -35,000 + 15,000?P a. Use the equations to fill in Qs and Qd at the prices listed in the table. Price Qs Qd Surplus or Shortage $6.00 $5.00 $4.00 $3.00 $2.00 $1.00

b. Find the difference between Qs and Qd at each price. Indicate if it is a surplus, , a shortage, or neither. (Surplus if Qs is greater and shortage if Qd is greater.) c. What is the equilibrium price? (Where Qd = Qs)
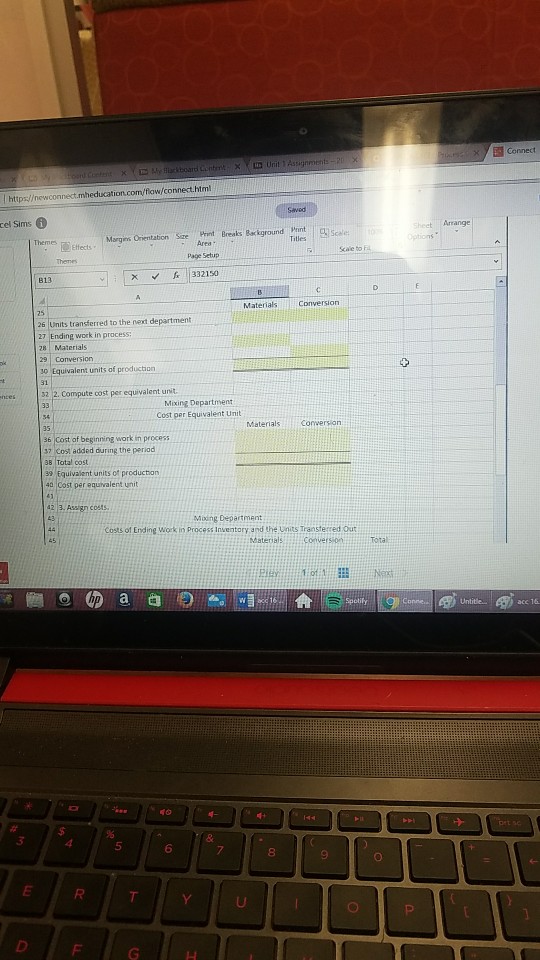
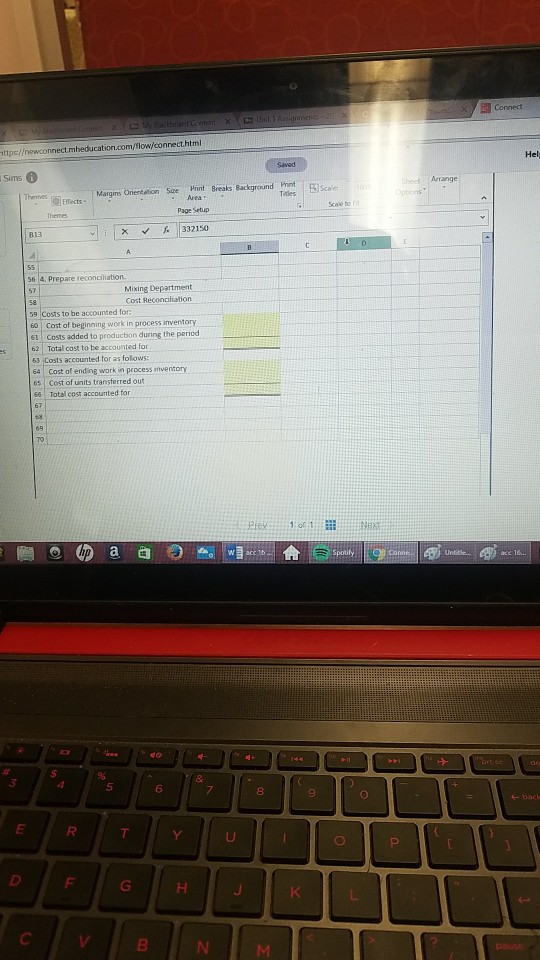
image text in transcribedimage text in transcribedimage text in transcribedimage text in transcribed
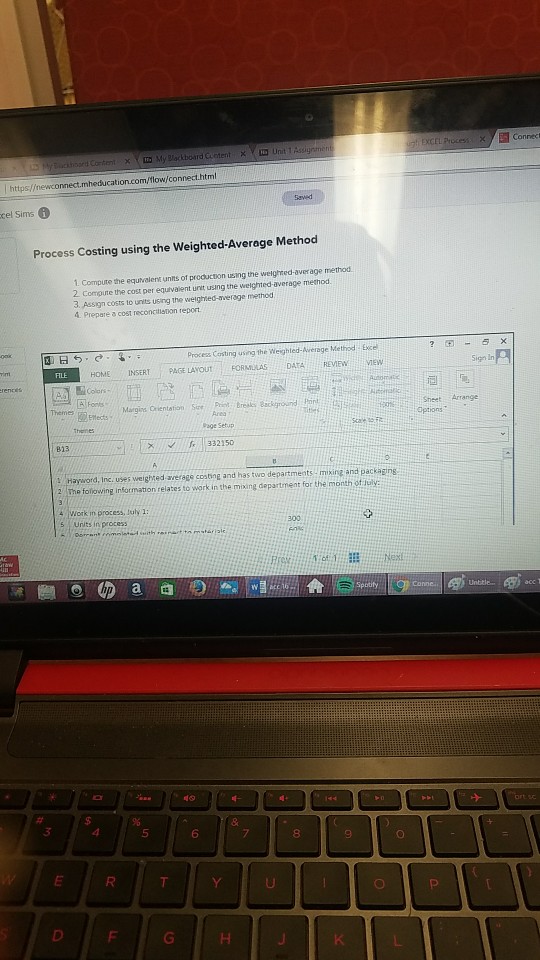
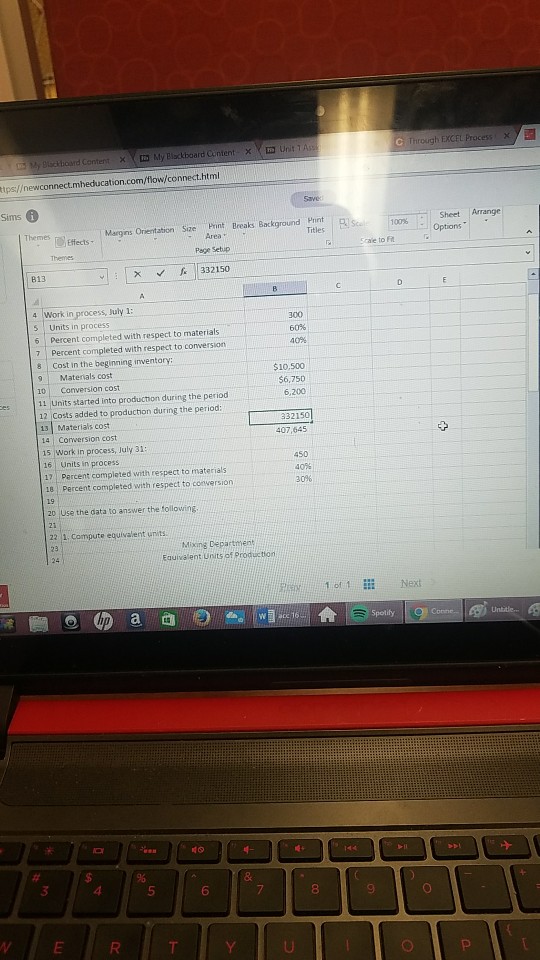
Connect https:/ewconnect.mheducation.com/flaw/connect.html Saved cel Sims Sheet Arange Themes Print Breaks Background Want Effects . Margin Orientation Size Area Tilles Options" Scale to Fil Themes Page Setup B17 X 332150 25 Materials Conversion 26 Units transferred to the next department 27 Ending work in process; 21 Materials 29 Conversion 30 Equivalent units of production 31 52 2. Compute cost per equivalent unit. 33 Mixing Department Cost per Equivalent Unit 35 Materials 36 Cost of beginning work in process 37 cost added during the period 38 Total cost 34 Equivalent units of production 40 Cost per equivalent unit 41 42 3. Assign costs. 43 Miding Department 44 Costs of Ending Work in Process Inventory and the Units Transferred Out Materials Conversion Ner hp a Spulily Untitle God acc 10 CH 8 E R T Y DConnect itips/ewconnect.mheducation.com/flow/connect.html Saved Hel Sims i Point Breaks Background Print Sheet Arrange Theme Effects- Margins Onentation Sure Arrat Tribes Dobons Theme Page Setup Scale to Fit 813 X 332150 55 56 4. Prepare reconciliation. 57 Mixing Department 58 Cost Reconciliation 59 Costs to be accounted for Cost of beginning work in process inventory 51 Costs added to production during the period 62 Total cost to be accounted for 63 Costs accounted for as follows: 64 Cast of ending work in process inventory 65 Cost of units transferred out 56 Total cost accounted for 67 69 TO hp We acc 1b spotily Untitle E R T D F G H K C V B N Moh EXCEL Process Cannes My Buckboard Curent * \\ My Backboard Ciment & In Unit 1 Assignment https/ewconnect.mheducation.com/flow/connect.html Saved cel Sims Process Costing using the Weighted-Average Method 1. Compute the equivalent units of production using the weighted average method. 2. Compine the cost per equivalent unit using the weighted average method. 3. Assign costs to units using the weighted-average method, 4. Prepare a cost reconciliation report Process Costing using the Weighted-Average Method : Exce ? FILE HOME INSERT PAGE LAYOUT FORMIMAS DATA REVIEW VIEW Sign In rence's Colan- Amnom DE Themes Manging Orientation Sup Print Breaker Background Pants Sheet Arrange 7 Elects" Area Options Thenes Page Setup B13 332150 Hayward, Inc. uses weighted average coating and has two departments . mixing and packaging The following information relates to work in the mixing department for the month of july: Work in process, July 1: Units in process 300 + Next hp a Spouty Conne Untilc 47 acc E R Y O P D G H K14 My Beckbond Content * \\m My Blackboard Content x ( m Unit 1Ap C Through EXCEL Process tips:/ewconnect.mheducation.com/flow/connect.html Sayiy Sims Print Breaks Background Print Sheet Arange Themes 1073 Effects - Margins Orientation Size Area Titles Options Themes Page Setup Grate to Fil 813 332150 B C D E 4 Work in process, July 1: 5 Units in process 300 Percent completed with respect to materials Percent completed with respect to conversion Cost in the beginning inventory; Materials cost $10.500 10 Conversion cost $6,750 11 Units started into production during the period 6,200 12 Costs added to production during the period: 13 Materials cost 332150 14 Conversion cost 407 045 15 Work in process, July 31: 16|Units in process 450 17| Parcent completed with respect to materials 18 Percent completed with respect to conversion 30% 19 20 Use the data to answer the following. 21 23 1, Compute equivalent units 23 Mixing Department Equivalent Units of Production Next hp a WE ace 164 Spotify 9 Conne Untitle.. 5 6 E R

Step by Step Solution

There are 3 Steps involved in it

Step: 1

blur-text-image

Get Instant Access to Expert-Tailored Solutions

See step-by-step solutions with expert insights and AI powered tools for academic success

Step: 2

blur-text-image

Step: 3

blur-text-image

Ace Your Homework with AI

Get the answers you need in no time with our AI-driven, step-by-step assistance

Get Started

Recommended Textbook for

Beginning Algebra A Text/Workbook

Authors: Charles P McKeague

2nd Edition

1483271242, 9781483271248

More Books

Students also viewed these Mathematics questions

Question

5. List the forces that shape a groups decisions

Answered: 1 week ago

Question

4. Identify how culture affects appropriate leadership behavior

Answered: 1 week ago