Answered step by step
Verified Expert Solution
Link Copied!

Question

1 Approved Answer

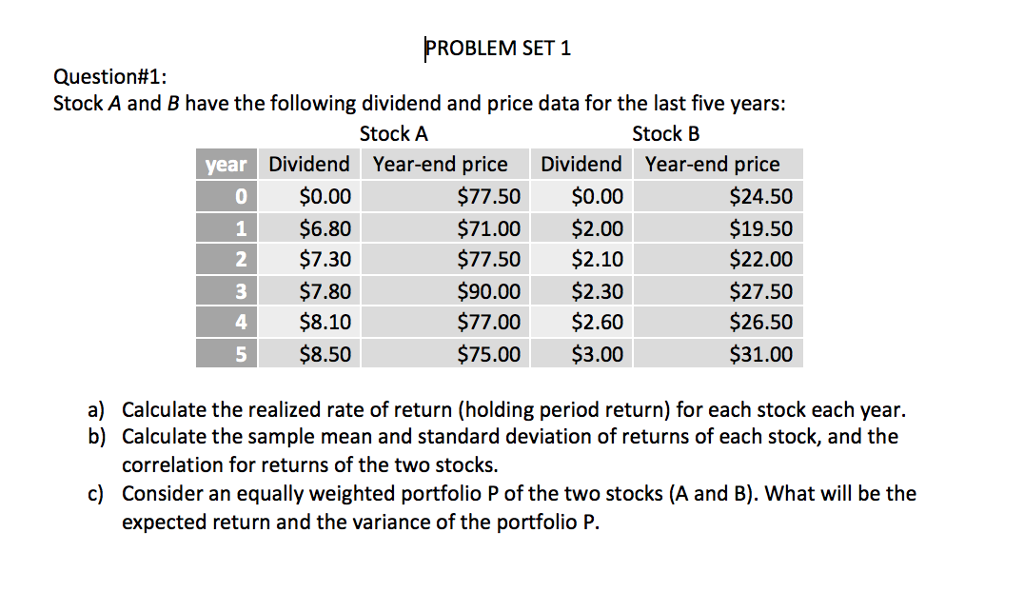
. . . PROBLEM SET 1 Question#1: Stock A and B have the following dividend and price data for the last five years: Stock A

.

.

.

image text in transcribed

PROBLEM SET 1 Question#1: Stock A and B have the following dividend and price data for the last five years: Stock A Stock B Dividend Year-end price Dividend Year-end price year 0 2 3 4 5 $0.00 $6.80 $7.30 $7.80 $8.10 $77.50$0.00 $71.00 $2.00 $77.50$2.10 $90.00$2.30 $77.00$2.60 $75.00 $3.00 $24.50 $19.50 $22.00 $27.50 $26.50 $31.00 a) Calculate the realized rate of return (holding period return) for each stock each year. b) Calculate the sample mean and standard deviation of returns of each stock, and the correlation for returns of the two stocks. Consider an equally weighted portfolio P of the two stocks (A and B). What will be the expected return and the variance of the portfolio P. c)

Step by Step Solution

There are 3 Steps involved in it

Step: 1

blur-text-image

Get Instant Access to Expert-Tailored Solutions

See step-by-step solutions with expert insights and AI powered tools for academic success

Step: 2

blur-text-image

Step: 3

blur-text-image

Ace Your Homework with AI

Get the answers you need in no time with our AI-driven, step-by-step assistance

Get Started

Recommended Textbook for

Economics For Financial Markets

Authors: Brian Kettell

1st Edition

0750653841, 978-0750653848

More Books

Students also viewed these Finance questions

Question

What is the purpose of the double-entry accounting system?

Answered: 1 week ago