Answered step by step
Verified Expert Solution
Link Copied!

Question

1 Approved Answer

Problem Solving (Measures of Center and Variation)(20pts) 3. The circle graph shows the distribution of the ages of 200 students in a college Psychology I
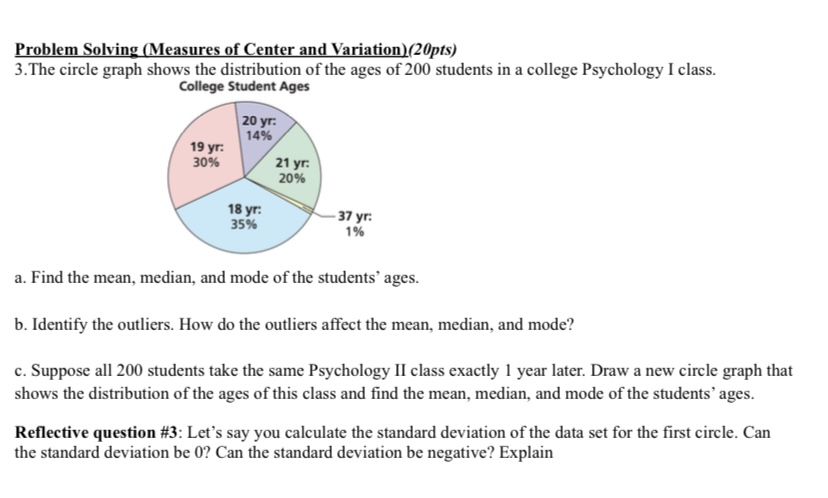
image text in transcribed
Problem Solving (Measures of Center and Variation)(20pts) 3. The circle graph shows the distribution of the ages of 200 students in a college Psychology I class. College Student Ages 20 yr: 14% 19 yr: 30% 21 yr. 20% 18 yr: 35% 37 yr. 1% a. Find the mean, median, and mode of the students' ages. b. Identify the outliers. How do the outliers affect the mean, median, and mode? c. Suppose all 200 students take the same Psychology II class exactly 1 year later. Draw a new circle graph that shows the distribution of the ages of this class and find the mean, median, and mode of the students' ages. Reflective question #3: Let's say you calculate the standard deviation of the data set for the first circle. Can the standard deviation be 0? Can the standard deviation be negative? Explain

Step by Step Solution

There are 3 Steps involved in it

Step: 1

blur-text-image

Get Instant Access to Expert-Tailored Solutions

See step-by-step solutions with expert insights and AI powered tools for academic success

Step: 2

blur-text-image

Step: 3

blur-text-image

Ace Your Homework with AI

Get the answers you need in no time with our AI-driven, step-by-step assistance

Get Started

Recommended Textbook for

Introduction to Probability

Authors: Mark Daniel Ward, Ellen Gundlach

1st edition

716771098, 978-1319060893, 1319060897, 978-0716771098

More Books

Students also viewed these Mathematics questions

Question

Explain the five possessory interests in land.

Answered: 1 week ago