

Answered step by step
Verified Expert Solution
Question
1 Approved Answer
Problem Statement: Create a MATLAB figure with four subplots arranged in a 2 2 grid. Each subplot should contain a plot of a different mathematical
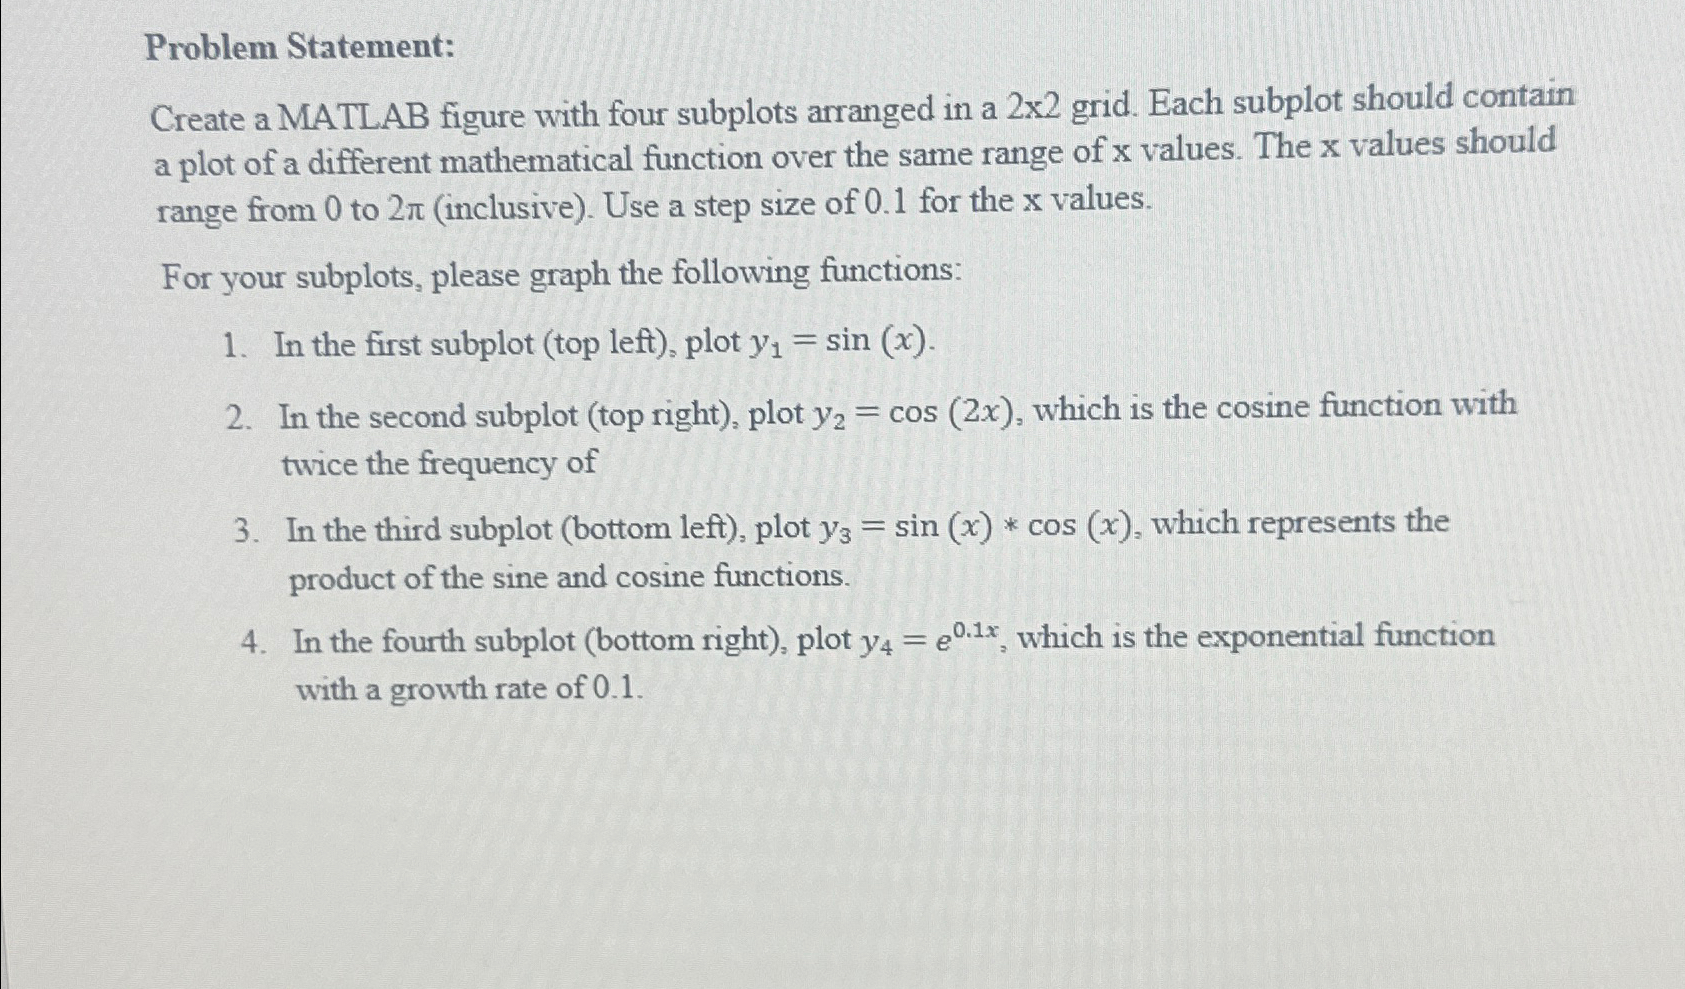
Problem Statement:
Create a MATLAB figure with four subplots arranged in a grid. Each subplot should contain a plot of a different mathematical function over the same range of values. The values should range from to inclusive Use a step size of for the values.
For your subplots, please graph the following functions:
In the first subplot top left plot
In the second subplot top right plot which is the cosine function with twice the frequency of
In the third subplot bottom left plot which represents the product of the sine and cosine functions.
In the fourth subplot bottom right plot which is the exponential function with a growth rate of
Step by Step Solution
There are 3 Steps involved in it
Step: 1

Get Instant Access to Expert-Tailored Solutions
See step-by-step solutions with expert insights and AI powered tools for academic success
Step: 2

Step: 3
Ace Your Homework with AI
Get the answers you need in no time with our AI-driven, step-by-step assistance
Get Started
Demystifying Databases A Hands On Guide For Database Management
Authors: Shiva Sukula
1st Edition
8170005345, 978-8170005346