

Answered step by step
Verified Expert Solution
Question
1 Approved Answer
Design and implement a simple program that processes examination scores from a data file. The program will determine statistics about the examination, including letter
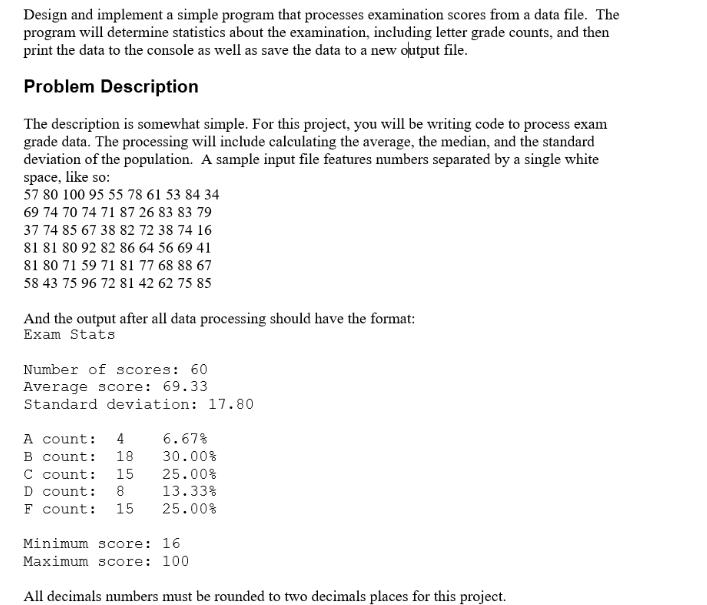
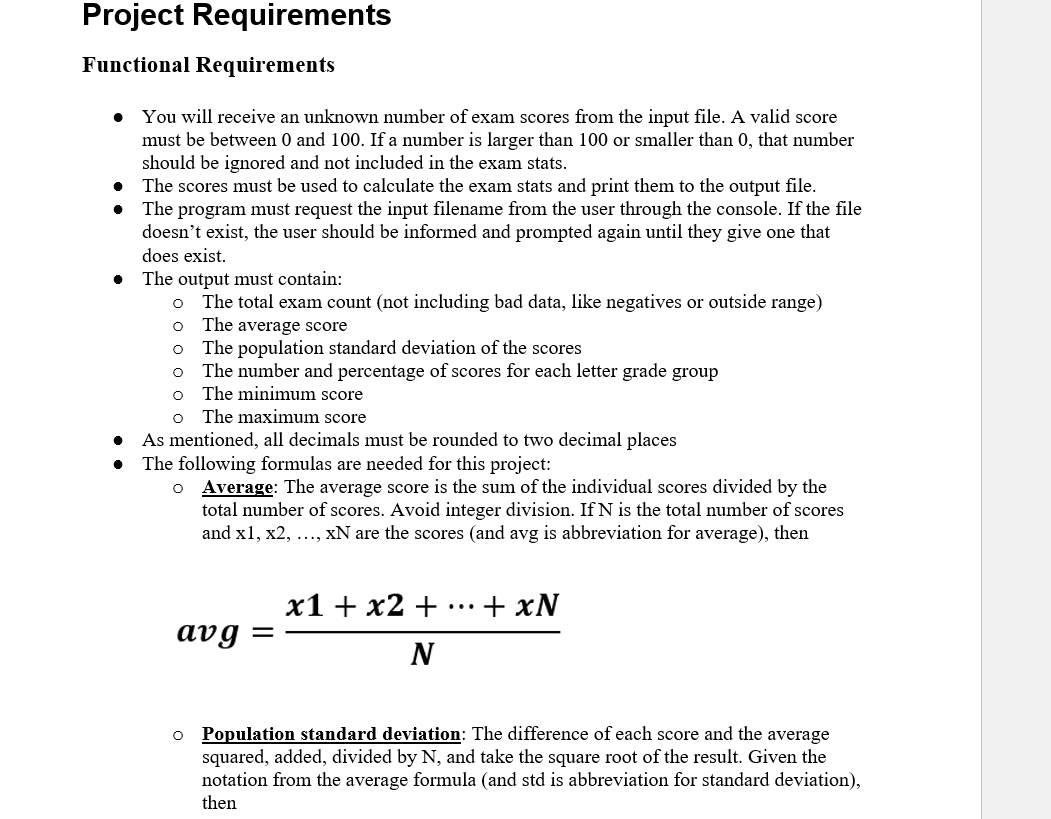
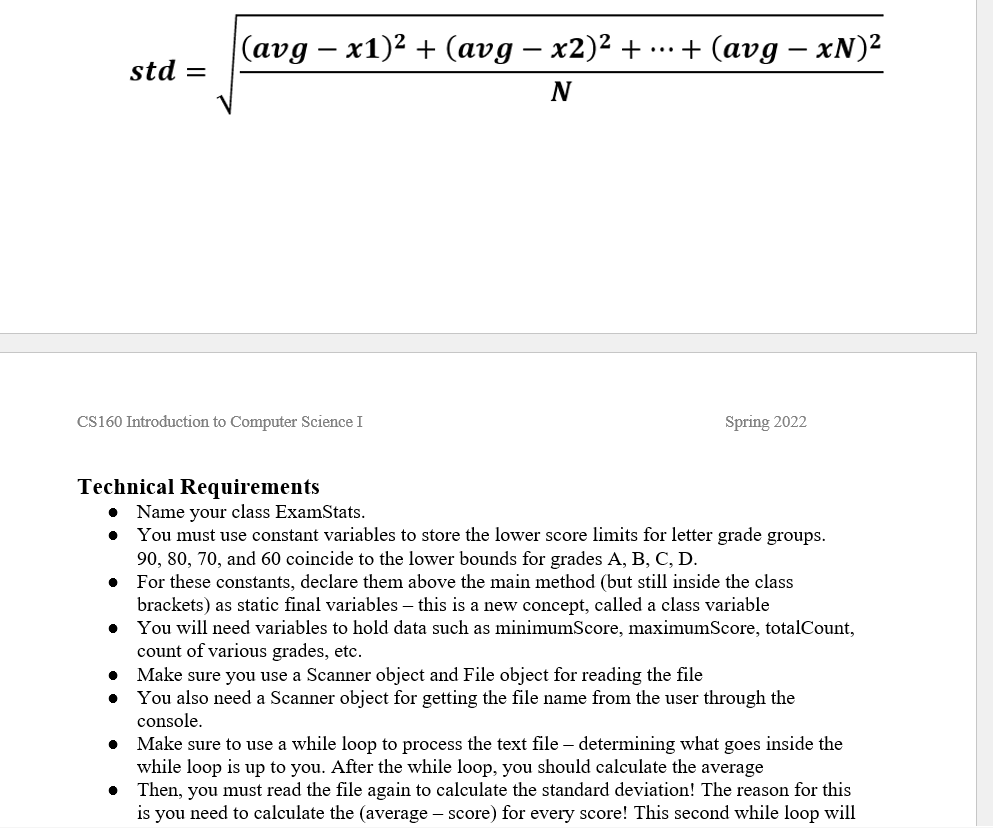
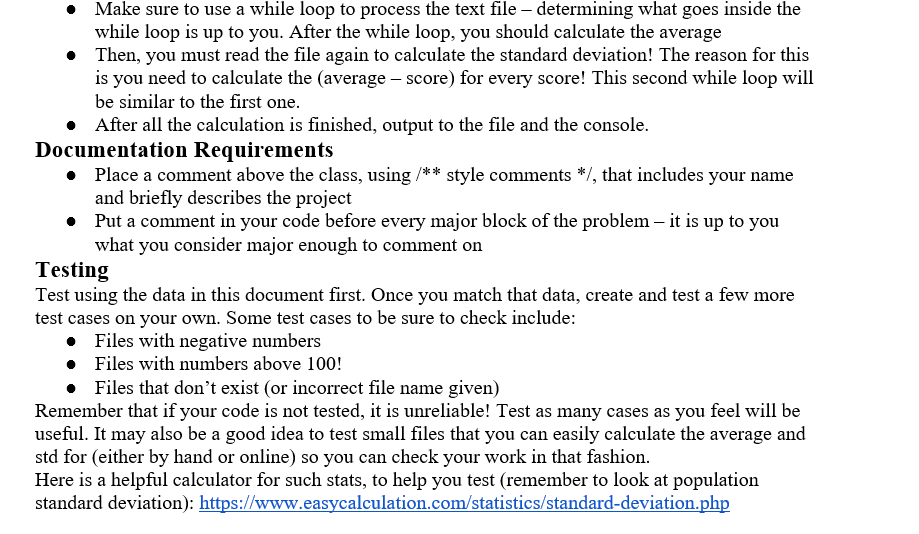
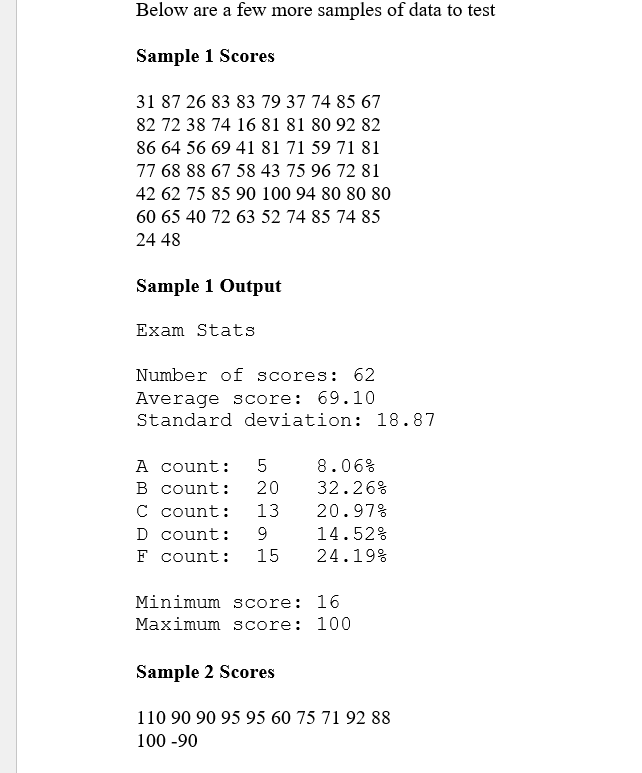
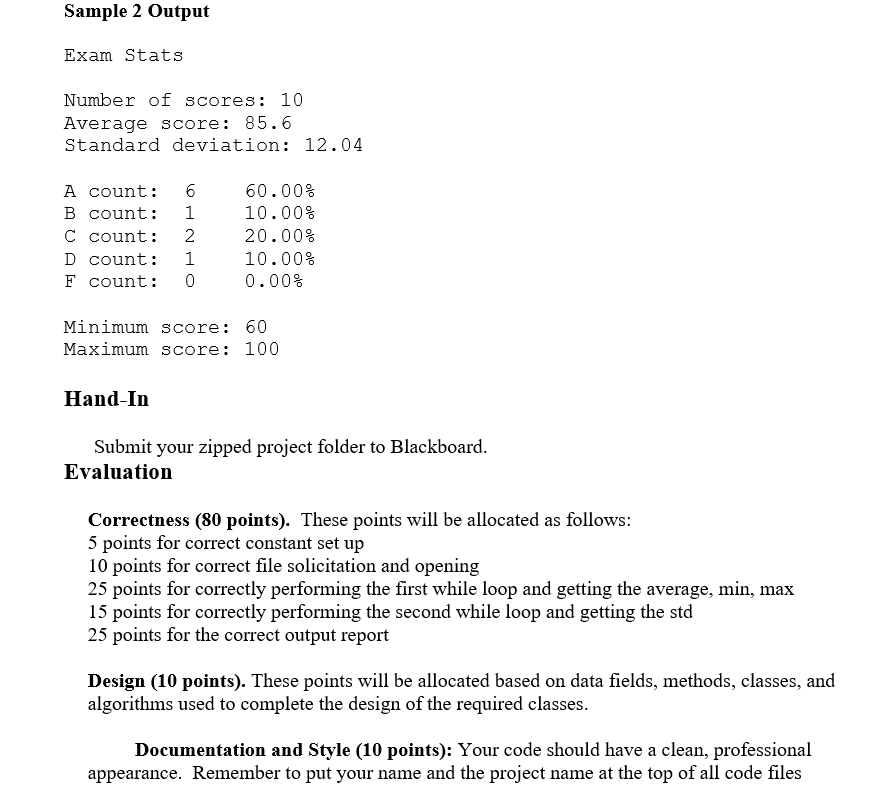
Design and implement a simple program that processes examination scores from a data file. The program will determine statistics about the examination, including letter grade counts, and then print the data to the console as well as save the data to a new output file. Problem Description The description is somewhat simple. For this project, you will be writing code to process exam grade data. The processing will include calculating the average, the median, and the standard deviation of the population. A sample input file features numbers separated by a single white space, like so: 57 80 100 95 55 78 61 53 84 34 69 74 70 74 71 87 26 83 83 79 37 74 85 67 38 82 72 38 74 16 81 81 80 92 82 86 64 56 69 41 81 80 71 59 71 81 77 68 88 67 58 43 75 96 72 81 42 62 75 85 And the output after all data processing should have the format: Exam Stats Number of scores: 60 Average score: 69.33 Standard deviation: 17.80 ALL CO A count: 4 6.67% B count: 18 30.00% COL 15 25.00% 13.33% F count: 15 25.00% C count: D count: 8 Minimum score: 16 Maximum score: 100 All decimals numbers must be rounded to two decimals places for this project. Project Requirements Functional Requirements You will receive an unknown number of exam scores from the input file. A valid score must be between 0 and 100. If a number is larger than 100 or smaller than 0, that number should be ignored and not included in the exam stats. The scores must be used to calculate the exam stats and print them to the output file. The program must request the input filename from the user through the console. If the file doesn't exist, the user should be informed and prompted again until they give one that does exist. The output must contain: o The total exam count (not including bad data, like negatives or outside range) o The average score O O O O The population standard deviation of the scores The number and percentage of scores for each letter grade group The minimum score The maximum score As mentioned, all decimals must be rounded to two decimal places The following formulas are needed for this project: Average: The average score is the sum of the individual scores divided by the total number of scores. Avoid integer division. If N is the total number of scores and x1, x2, ..., xN are the scores (and avg is abbreviation for average), then O avg = O x1 + x2 + N +xN Population standard deviation: The difference of each score and the average squared, added, divided by N, and take the square root of the result. Given the notation from the average formula (and std is abbreviation for standard deviation), then std = (avg x1) + (avg x2) + ... + (avg xN) - N CS160 Introduction to Computer Science I Technical Requirements Spring 2022 Name your class ExamStats. You must use constant variables to store the lower score limits for letter grade groups. 90, 80, 70, and 60 coincide to the lower bounds for grades A, B, C, D. For these constants, declare them above the main method (but still inside the class brackets) as static final variables - this is a new concept, called a class variable You will need variables to hold data such as minimumScore, maximumScore, totalCount, count of various grades, etc. Make sure you use a Scanner object and File object for reading the file You also need a Scanner object for getting the file name from the user through the console. Make sure to use a while loop to process the text file determining what goes inside the while loop is up to you. After the while loop, you should calculate the average Then, you must read the file again to calculate the standard deviation! The reason for this is you need to calculate the (average score) for every score! This second while loop will Make sure to use a while loop to process the text file determining what goes inside the while loop is up to you. After the while loop, you should calculate the average Then, you must read the file again to calculate the standard deviation! The reason for this is you need to calculate the (average - score) for every score! This second while loop will be similar to the first one. After all the calculation is finished, output to the file and the console. Documentation Requirements Place a comment above the class, using /** style comments */, that includes your name and briefly describes the project Put a comment in your code before every major block of the problem it is up to you what you consider major enough to comment on Testing Test using the data in this document first. Once you match that data, create and test a few more test cases on your own. Some test cases to be sure to check include: Files with negative numbers Files with numbers above 100! Files that don't exist (or incorrect file name given) Remember that if your code is not tested, it is unreliable! Test as many cases as you feel will be useful. It may also be a good idea to test small files that you can easily calculate the average and std for (either by hand or online) so you can check your work in that fashion. Here is a helpful calculator for such stats, to help you test (remember to look at population standard deviation): https://www.easycalculation.com/statistics/standard-deviation.php Below are a few more samples of data to test Sample 1 Scores 31 87 26 83 83 79 37 74 85 67 82 72 38 74 16 81 81 80 92 82 86 64 56 69 41 81 71 59 71 81 77 68 88 67 58 43 75 96 72 81 42 62 75 85 90 100 94 80 80 80 60 65 40 72 63 52 74 85 74 85 24 48 Sample 1 Output Exam Stats Number of scores: 62 Average score: 69.10 Standard deviation: 18.87 A count: 5 B count: 20 C count: 13 D count: 9 F count: 15 8.06% 32.26% 20.97% Sample 2 Scores 14.52% 24.19% Minimum score: 16 Maximum score: 100 110 90 90 95 95 60 75 71 92 88 100 -90 Sample 2 Output Exam Stats Number of scores: 10 Average score: 85.6 Standard deviation: 12.04 A count: 6 60.00% B count: 1 10.00% C count: 2 20.00% D count: 1 10.00% F count: 0 0.00% 612 Minimum score: 60 Maximum score: 100 Hand-In Submit your zipped project folder to Blackboard. Evaluation Correctness (80 points). These points will be allocated as follows: 5 points for correct constant set up 10 points for correct file solicitation and opening 25 points for correctly performing the first while loop and getting the average, min, max 15 points for correctly performing the second while loop and getting the std 25 points for the correct output report Design (10 points). These points will be allocated based on data fields, methods, classes, and algorithms used to complete the design of the required classes. Documentation and Style (10 points): Your code should have a clean, professional appearance. Remember to put your name and the project name at the top of all code files
Step by Step Solution
There are 3 Steps involved in it
Step: 1
Below is a simple Java program that meets the specified requirements import javautilScanner import javaioFile import javaioFileNotFoundException import javaioPrintWriter public class ExamStats Constan...
Get Instant Access to Expert-Tailored Solutions
See step-by-step solutions with expert insights and AI powered tools for academic success
Step: 2

Step: 3
Ace Your Homework with AI
Get the answers you need in no time with our AI-driven, step-by-step assistance
Get Started
Process Dynamics And Control
Authors: Dale E. Seborg, Thomas F. Edgar, Duncan A. Mellich
2nd Edition
471000779, 978-0471000778