

Question: Problem Statement The Monte Carlo (MC) method is a probabilistic model or simulation with a wide range of applications. In this Project you will create
Problem Statement
The Monte Carlo (MC) method is a probabilistic model or simulation with a wide range of applications. In this Project you will create a program such that it applies Monte Carlo to compute (approximate) the area of some planar figures. The figure in question is encased into a reference domain that is, another figure with known area, usually a square or a rectangle.
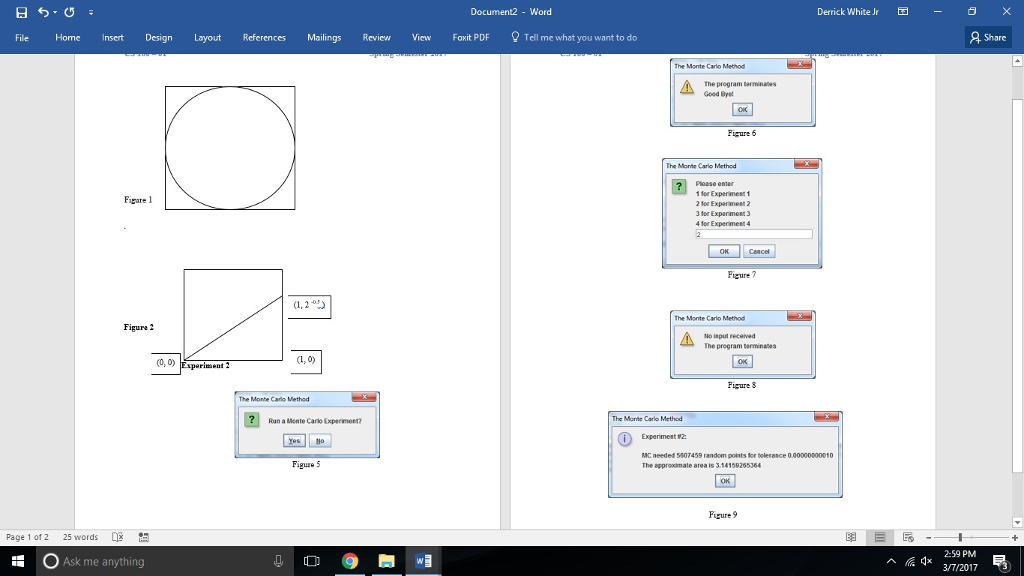
As an example we see above a circle inscribed in a square (Figure 1). The radius of the circle is 1, then the side of the square is 2, its area is 4. The problem of finding the circular area is the same as finding the value of PI. Even if we know nothing about this constant, the MC algorithm can estimate the area with any given accuracy.
In the MC algorithm we generate a large number of random points from the encasing domain and we keep counting how many of the selected points belong to the figure of unknown area. The underlying hypothesis is that the random points are distributed evenly over the reference domain, thus we can expect that the ratio (Area of Circle) / (Area of Square) is approximately the same as the ratio (# of points in the Circle) / (# of points in the Square).
In general, the MC area formula runs as follows
(*) A figure ( P figure / P reference ) * (A reference)
where
A figure is the unknown area of the given figure,
A reference is the area of the encasing reference domain,
P figureis the number of points counted in the given figure,
P reference is the total number of points generated in the reference domain.
Another interpretation makes the method quite an intuitive one. Imagine that our shape is drawn upon a target board, and a large number of random shots fired at the board. If, say half of the shots hit the shape, we may reasonably take the shapes area about half of that of the entire board.
In this project you have to write a program such that it makes four experiments with the MC application.
Experiment 1
Encasing reference domain: unit square [0, 1] x [0, 1]
Figure of unknown area: the triangle cut from the unit square by the line y = 2 - 0.5 x (note that the slope is available in Java as Math.sqrt(0.5) or Math.pow(2, -0.5)) (see
Figure 2)
| (1, 2 -0.5 ) |
| (1, 0) |
| (0, 0) |
Experiment 2
Encasing reference domain: square [-1, 1] x [-1, 1]
Figure of unknown area: the inscribed circle of radius 1 (see Figure 1)
Experiment 3
Encasing reference domain: unit square [0, 1] x [0, 1]
Figure of unknown area: the region under the parabola arc y = x2 (see Figure 3)
Figure 3
Experiment 4
Encasing reference domain: rectangle [0, ] x [0, 1]
Figure of unknown area: the region under the arc of the sin (x) function (see Figure 4) (You do not have to construct the window of Figure 4, this is not a JOptionPane window).
Figure 4
Analysis and Requirements
The analysis phase of software development describes the logical structure of the problem in a way which helps us to plan (design) a solution.
We make the following simple observations.
The logic of the MC iteration is the same for all Experiments as follows:
At each turn of the iteration a new random point is selected from the reference domain
A boolean formula for an if statement is needed to check if the selected point is in the contained figure (different Experiments require different booleans)
A nested if-else-if logic is needed within the loop to determine the boolean formula for the current Experiment
Two counter variables are needed to count the total number of points and the number of points in the figure (the hits)
The total counter is always updated at every turn, hits is updated only if the boolean mentioned above allows
The random coordinates of a point are best generated by two calls of Math.random( ). These values are between 0 and 1, modification of the coordinates are needed in some Experiments.
In each turn of the loop the rate P_figure/P_reference and the approximate area is computed as described in formula (*)
The error is computed as the absolute difference of the approximate area and the exact area; the loop is terminated if the error less than the tolerance
After the loop an output message showing the results is displayed on a JOptionPane window
The necessary input values are the reference area and the exact area of the contained
figure
The input varies for different Experiments
Before the loop starts for a chosen Experiment, a switch logic is required to assign the input to the variables used in the loop
Given the coordinates x = Math.random, y = Math.random, the boolean formulas in order of Experiments 1 4 are as follows
y
(2*x -1)*(2*x -1 ) + (2*y-1)*(2*y - 1)
y
y
Input
Values for refArea and exact are assigned in a switch according to the selected
Experiment. The values are predetermined by Figures 1 4.
A value for tolerance (a power of 10) is solicited from the user, either on the console or on an input window, or you may directly assign it to the variable. Tolerance should be 1E-9 or less.
Output
Output is a report providing the result for the last choice of input values. Output shall be displayed on a JOptionPane window, see Figure 9
Design
The algorithm is clarified in the Analysis phase
Report requirements: See the output windows and additional requirements in the implementation phase
Program Design: For this project you shall design a single class which contains all the necessary data and operations needed for computations.
The suggested class name is MC_Experiments. You must decide upon the necessary import(s).
In the main method
Declare numeric variables for tolerance, reference area, exact area, x coordinate, y coordinate, error, total points counter, hit points counter (choose the types correct), a char type variable for the first character of an input string; string variable will also be needed for title text, message text etc.
Open a JOptionPane confirm dialog (see Figure 5)
Figure 5
for No answer the message of Figure 6 appears and the program terminates
-
Figure 6
For Yes answer an input dialog solicits an Experiment (Figure 7)
Figure 7
Input is validated, for null or empty string see Figure 8
Figure 8
For an acceptable input (see input 2 in Figure7) extract the character of index 0 from the input string, save it in a char type variable named theCase
Apply a switch statement controlled by theCase. There are four cases in the switch and a default; in the cases assign the variables refArea and exact the relevant
The default case takes care about a wrong character (other than 1, 2, 3, 4), it prints to the console the message
Wrong character for case number, the program terminates
Run a do while loop as explained in the Analysis
pseudo-code for the loop
1. before the loop declare a boolean variable condition, reset the counters total and hits to 0
2. do
update total
call Math.random to choose coordinates x and y randomly
use if else logic such that depending on theCase assign condition the relevant boolean expression, see the listing in the Analysis section
if condition true update the counter hits
compute the approximate area according to formula (*)
compute error
while
error greater than tolerance
The sample output is shown below (Figure 9)
Figure 9
Just for the case of Experiment 4 for you shall add one more loop to the code. The exact area below the sinus arc (and below the parabola arc, Experiment 3) needs integration, therefore it may not come as easy as the other two. The purpose of the added loop is a justification that value 2 is correct for that sin area.
Create a single if statement to make sure that Experiment 4 is considered, reset the hits counter to 0, set up a for loop that iterates 100,000,000 times, the code in the loop is the same as the one in the do-while (except the if-logic is not needed, we know which booelan applies)
After the loop, you print a message to the console showing the approximate area, see the template below
for loop approximation of the sin area with one hundred million iteration
2.0001651775037494
Implementation, Requirements
Variable names hinted above in the description. You may declare additional variables if needed.
Java skills beyond Chapter 4 in Starting Out with Java (6th Edition) not accepted
Run the program for each Experiment several times and collect the approximations. The length of the loop producing good approximations for the very same figure may widely spread over several magnitudes. Can you explain why?
When you run Experiment 4, the do-while can be much shorter than the for loop, still giving better results by several magnitudes. Why?
The loop for the parabola arc (Experiment 3) can be ridiculously short. It is not an error. Why could that happen?
Warning: the loops dealing with the circular area and sinus area may run for a relatively long time (say 20 seconds, can also depend on your machine) so be patient before you start looking for an infinite loop error.
Collect your output data and try to explain the mysterious events as mentioned above, and write up a text file report showing all you can add. Save the file in the project folder before zipping it.
Derrick White Jr X Documen Word Home Insert Design Layout References Mailings Review View Foxit PDF Q Tell me what you want to do File Share The Monte Carlo Method The prog Good Bye Figure 6 The Monte Carlo Method Finare l 2 for Experiment 3 for Experiment 4 for Experiment Figure 7 The Monte Carlo Method Figure No input received The program terminates ent 2 Figure 3 Run a Monte Carlo Experiment? Experiment MC needed 507459 random points for tolerance 0.0000000001 Figure 5 The approximate Furure 9 Page 1 of 2 25 words E ES AE 59 PM Ask me anything 3/7/2017 Derrick White Jr X Documen Word Home Insert Design Layout References Mailings Review View Foxit PDF Q Tell me what you want to do File Share The Monte Carlo Method The prog Good Bye Figure 6 The Monte Carlo Method Finare l 2 for Experiment 3 for Experiment 4 for Experiment Figure 7 The Monte Carlo Method Figure No input received The program terminates ent 2 Figure 3 Run a Monte Carlo Experiment? Experiment MC needed 507459 random points for tolerance 0.0000000001 Figure 5 The approximate Furure 9 Page 1 of 2 25 words E ES AE 59 PM Ask me anything 3/7/2017
Step by Step Solution
There are 3 Steps involved in it

Get step-by-step solutions from verified subject matter experts