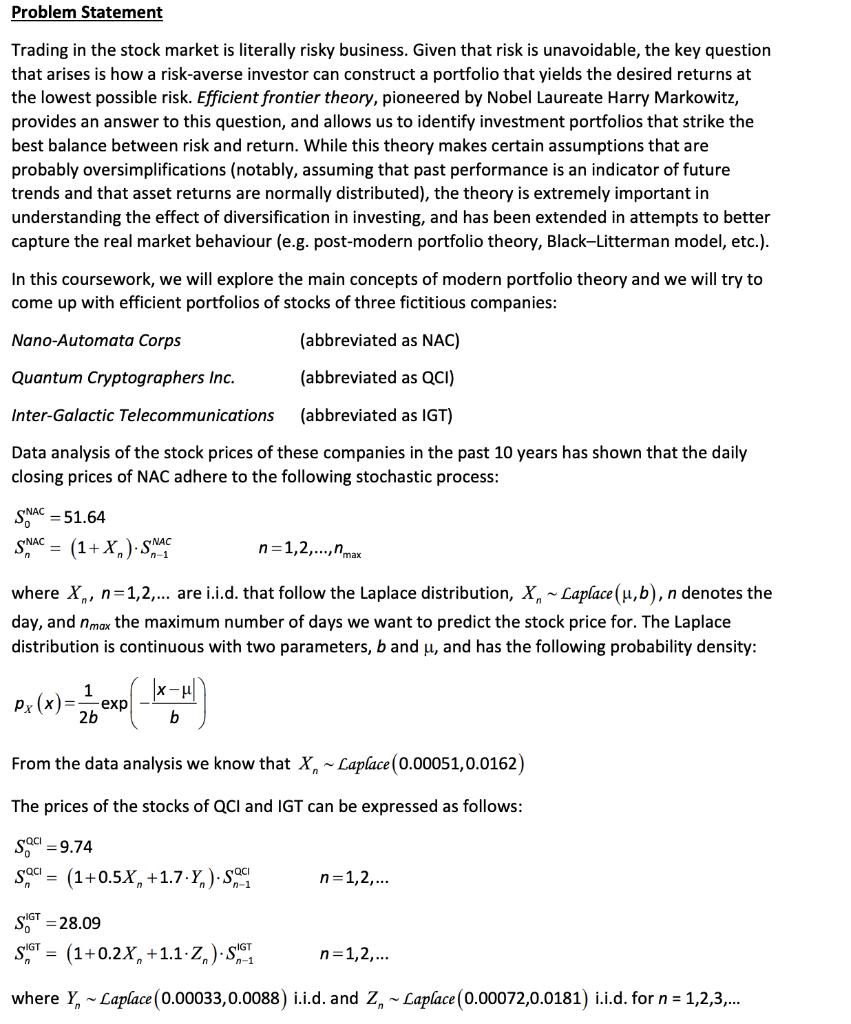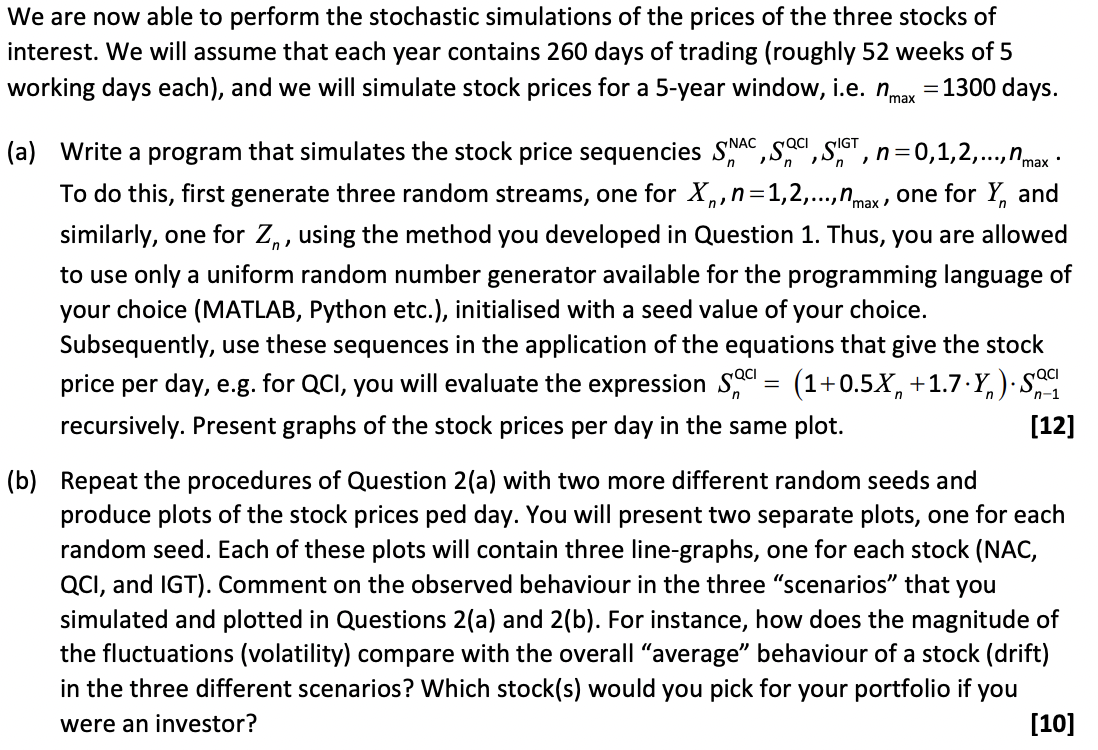

Problem Statement Trading in the stock market is literally risky business. Given that risk is unavoidable, the key question that arises is how a risk-averse investor can construct a portfolio that yields the desired returns at the lowest possible risk. Efficient frontier theory, pioneered by Nobel Laureate Harry Markowitz, provides an answer to this question, and allows us to identify investment portfolios that strike the best balance between risk and return. While this theory makes certain assumptions that are probably oversimplifications (notably, assuming that past performance is an indicator of future trends and that asset returns are normally distributed), the theory is extremely important in understanding the effect of diversification in investing, and has been extended in attempts to better capture the real market behaviour (e.g. post-modern portfolio theory, Black-Litterman model, etc.). In this coursework, we will explore the main concepts of modern portfolio theory and we will try to come up with efficient portfolios of stocks of three fictitious companies: Nano-Automata Corps (abbreviated as NAC) Quantum Cryptographers Inc. (abbreviated as QCI) Inter-Galactic Telecommunications (abbreviated as IGT) Data analysis of the stock prices of these companies in the past 10 years has shown that the daily closing prices of NAC adhere to the following stochastic process: NAC Son = 51.64 = (1+X,).SMAL SNAC n=1,2,...,nmax where X,, n=1,2,... are i.i.d. that follow the Laplace distribution, X, - Laplace(u,b), n denotes the day, and nmax the maximum number of days we want to predict the stock price for. The Laplace distribution is continuous with two parameters, b and u, and has the following probability density: 1 exp 2b lx-ul Px(x)= ) b From the data analysis we know that X, Laplace(0.00051,0.0162) The prices of the stocks of QCI and IGT can be expressed as follows: saci = 9.74 Saci = (1+0.5X, +1.7.Y,).. = n=1,2,... So' = 28.09 SUGT = (1+0.2X, +1.1.2.). SISI n=1,2,... where Y, ~Laplace (0.00033,0.0088) i.i.d. and Z, -Laplace(0.00072,0.0181) i.i.d. for n = 1,2,3,... We are now able to perform the stochastic simulations of the prices of the three stocks of interest. We will assume that each year contains 260 days of trading (roughly 52 weeks of 5 working days each), and we will simulate stock prices for a 5-year window, i.e. Nmax = 1300 days. 1 = n n n-1 (a) Write a program that simulates the stock price sequencies SNAC, S,QCI, SIGT, n=0,1,2,..., Nmax - To do this, first generate three random streams, one for X,,n=1,2,..., Nmax, one for Y, and similarly, one for Zn, using the method you developed in Question 1. Thus, you are allowed to use only a uniform random number generator available for the programming language of your choice (MATLAB, Python etc.), initialised with a seed value of your choice. Subsequently, use these sequences in the application of the equations that give the stock price per day, e.g. for QCI, you will evaluate the expression S,QC = (1+0.5X, +1.7.Y,).Som recursively. Present graphs of the stock prices per day in the same plot. [12] (b) Repeat the procedures of Question 2(a) with two more different random seeds and produce plots of the stock prices ped day. You will present two separate plots, one for each random seed. Each of these plots will contain three line-graphs, one for each stock (NAC, QCI, and IGT). Comment on the observed behaviour in the three "scenarios that you simulated and plotted in Questions 2(a) and 2(b). For instance, how does the magnitude of the fluctuations (volatility) compare with the overall "average behaviour of a stock (drift) in the three different scenarios? Which stock(s) would you pick for your portfolio if you were an investor? [10] Problem Statement Trading in the stock market is literally risky business. Given that risk is unavoidable, the key question that arises is how a risk-averse investor can construct a portfolio that yields the desired returns at the lowest possible risk. Efficient frontier theory, pioneered by Nobel Laureate Harry Markowitz, provides an answer to this question, and allows us to identify investment portfolios that strike the best balance between risk and return. While this theory makes certain assumptions that are probably oversimplifications (notably, assuming that past performance is an indicator of future trends and that asset returns are normally distributed), the theory is extremely important in understanding the effect of diversification in investing, and has been extended in attempts to better capture the real market behaviour (e.g. post-modern portfolio theory, Black-Litterman model, etc.). In this coursework, we will explore the main concepts of modern portfolio theory and we will try to come up with efficient portfolios of stocks of three fictitious companies: Nano-Automata Corps (abbreviated as NAC) Quantum Cryptographers Inc. (abbreviated as QCI) Inter-Galactic Telecommunications (abbreviated as IGT) Data analysis of the stock prices of these companies in the past 10 years has shown that the daily closing prices of NAC adhere to the following stochastic process: NAC Son = 51.64 = (1+X,).SMAL SNAC n=1,2,...,nmax where X,, n=1,2,... are i.i.d. that follow the Laplace distribution, X, - Laplace(u,b), n denotes the day, and nmax the maximum number of days we want to predict the stock price for. The Laplace distribution is continuous with two parameters, b and u, and has the following probability density: 1 exp 2b lx-ul Px(x)= ) b From the data analysis we know that X, Laplace(0.00051,0.0162) The prices of the stocks of QCI and IGT can be expressed as follows: saci = 9.74 Saci = (1+0.5X, +1.7.Y,).. = n=1,2,... So' = 28.09 SUGT = (1+0.2X, +1.1.2.). SISI n=1,2,... where Y, ~Laplace (0.00033,0.0088) i.i.d. and Z, -Laplace(0.00072,0.0181) i.i.d. for n = 1,2,3,... We are now able to perform the stochastic simulations of the prices of the three stocks of interest. We will assume that each year contains 260 days of trading (roughly 52 weeks of 5 working days each), and we will simulate stock prices for a 5-year window, i.e. Nmax = 1300 days. 1 = n n n-1 (a) Write a program that simulates the stock price sequencies SNAC, S,QCI, SIGT, n=0,1,2,..., Nmax - To do this, first generate three random streams, one for X,,n=1,2,..., Nmax, one for Y, and similarly, one for Zn, using the method you developed in Question 1. Thus, you are allowed to use only a uniform random number generator available for the programming language of your choice (MATLAB, Python etc.), initialised with a seed value of your choice. Subsequently, use these sequences in the application of the equations that give the stock price per day, e.g. for QCI, you will evaluate the expression S,QC = (1+0.5X, +1.7.Y,).Som recursively. Present graphs of the stock prices per day in the same plot. [12] (b) Repeat the procedures of Question 2(a) with two more different random seeds and produce plots of the stock prices ped day. You will present two separate plots, one for each random seed. Each of these plots will contain three line-graphs, one for each stock (NAC, QCI, and IGT). Comment on the observed behaviour in the three "scenarios that you simulated and plotted in Questions 2(a) and 2(b). For instance, how does the magnitude of the fluctuations (volatility) compare with the overall "average behaviour of a stock (drift) in the three different scenarios? Which stock(s) would you pick for your portfolio if you were an investor? [10]


