Answered step by step
Verified Expert Solution
Link Copied!

Question

1 Approved Answer

Problem: The U.S. Trade Deficits for the first half of 1989 are shown on the next page in Figure 6.9. Plot these values and their

Problem: The U.S. Trade Deficits for the first half of 1989 are shown on the next page in Figure 6.9. Plot these values and their moving ranges on the form given in Figure 6.10.
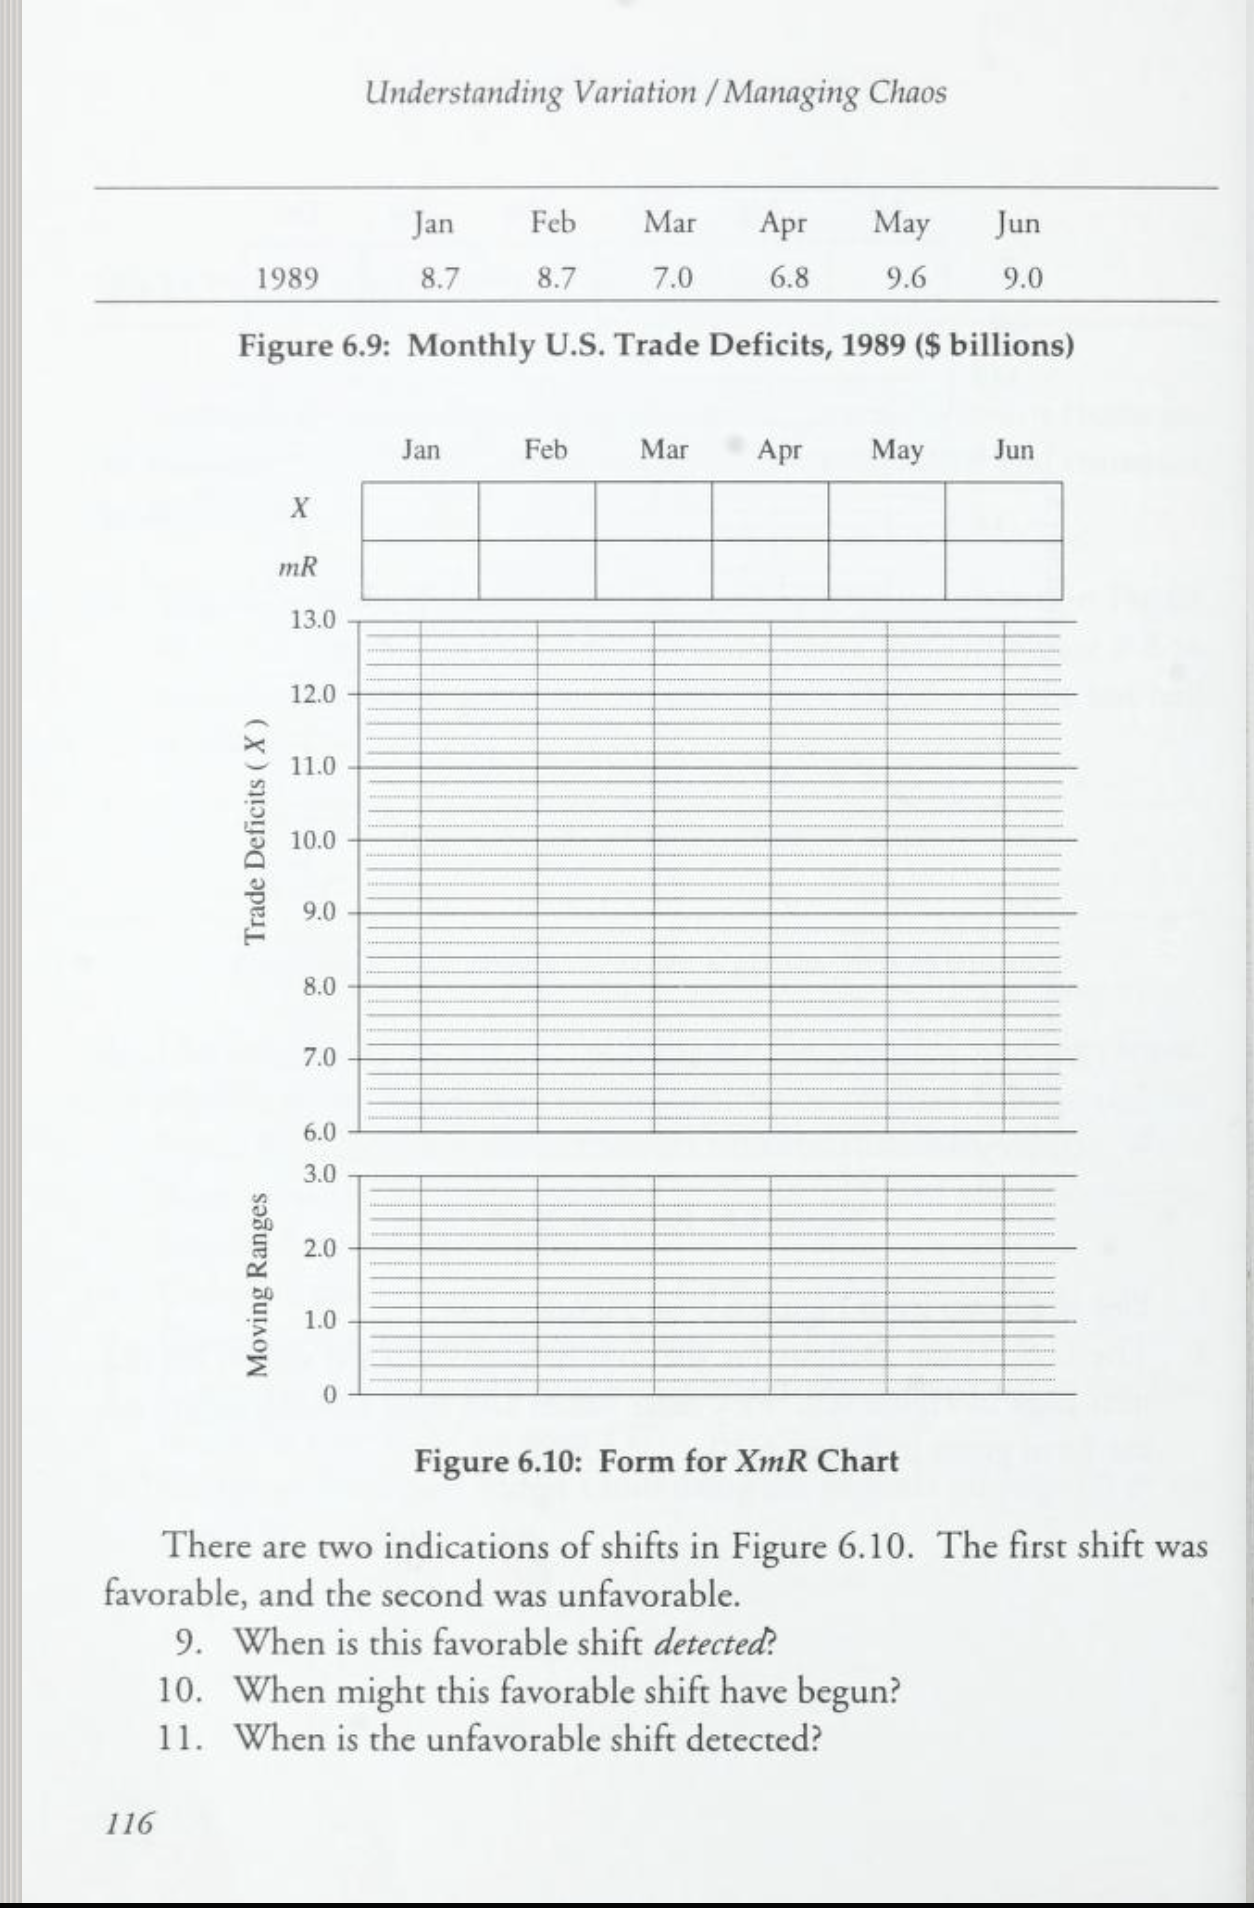
image text in transcribed
Understanding Variation / Managing Chaos Jan Feb Mar Apr May Jun 1989 8.7 8.7 7.0 6.8 9.6 9.0 Figure 6.9: Monthly U.S. Trade Deficits, 1989 ($ billions) Jan Feb Mar Apr May Jun X MR 13.0 12.0 11.0 Trade Deficits ( X ) 10.0 9.0 8.0 7.0 6.0 3.0 2.0 Moving Ranges 1.0 0 Figure 6.10: Form for Xml Chart There are two indications of shifts in Figure 6.10. The first shift was favorable, and the second was unfavorable. 9. When is this favorable shift detected? 10. When might this favorable shift have begun? 11. When is the unfavorable shift detected? 116

Step by Step Solution

There are 3 Steps involved in it

Step: 1

blur-text-image

Get Instant Access to Expert-Tailored Solutions

See step-by-step solutions with expert insights and AI powered tools for academic success

Step: 2

blur-text-image_2

Step: 3

blur-text-image_3

Ace Your Homework with AI

Get the answers you need in no time with our AI-driven, step-by-step assistance

Get Started

Recommended Textbook for

Advanced Calculus

Authors: R Creighton Buck

3rd Edition

147861613X, 9781478616139

More Books

Students also viewed these Mathematics questions

Question

Describe the types of power that effective leaders employ

Answered: 1 week ago

Question

Describe how leadership styles should be adapted to the situation

Answered: 1 week ago