Answered step by step
Verified Expert Solution
Question
1 Approved Answer
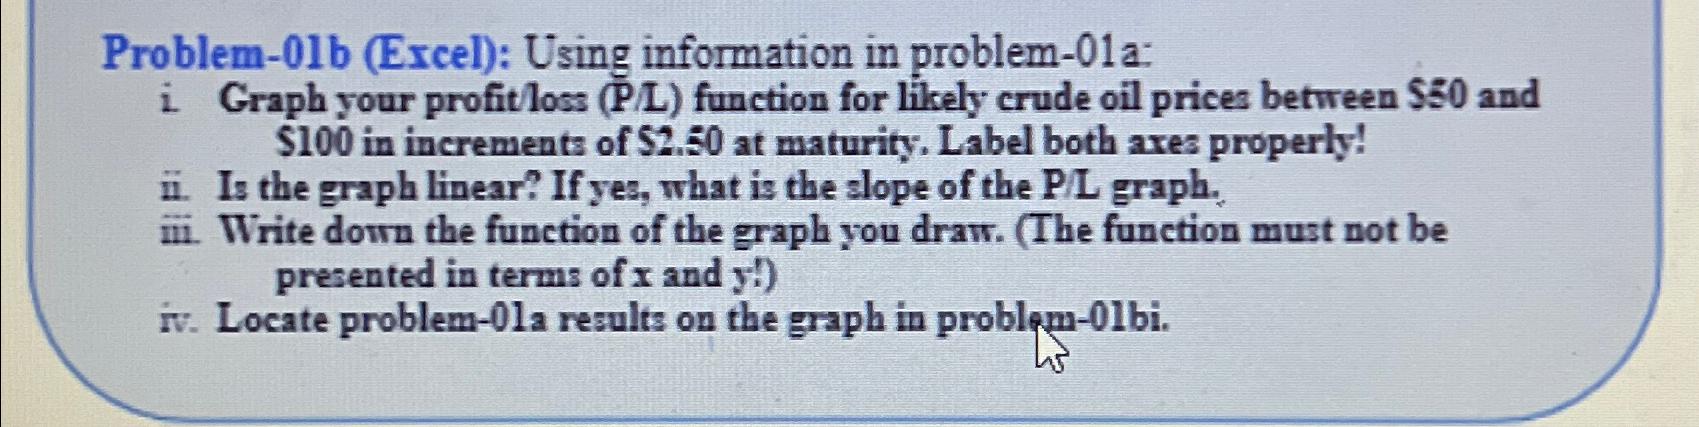
Problem-01b (Excel): Using information in problem-01a: i. Graph your profit/oss (P/L) function for likely crude oil prices between $50 and $100 in increments of $2.50
Problem-01b (Excel): Using information in problem-01a:\ i. Graph your profit/oss (P/L) function for likely crude oil prices between
$50and
$100in increments of
$2.50at maturity. Label both axes properly!\ ii. Is the graph linear? If yes, what is the slope of the
(P)/(L)graph.\ iii. Write down the function of the graph you draw. (The function must not be presented in terms of
xand
y^('))\ iv. Locate problem-01 a results on the graph in problem-01bi.
Step by Step Solution
There are 3 Steps involved in it
Step: 1

Get Instant Access to Expert-Tailored Solutions
See step-by-step solutions with expert insights and AI powered tools for academic success
Step: 2

Step: 3
Ace Your Homework with AI
Get the answers you need in no time with our AI-driven, step-by-step assistance
Get Started