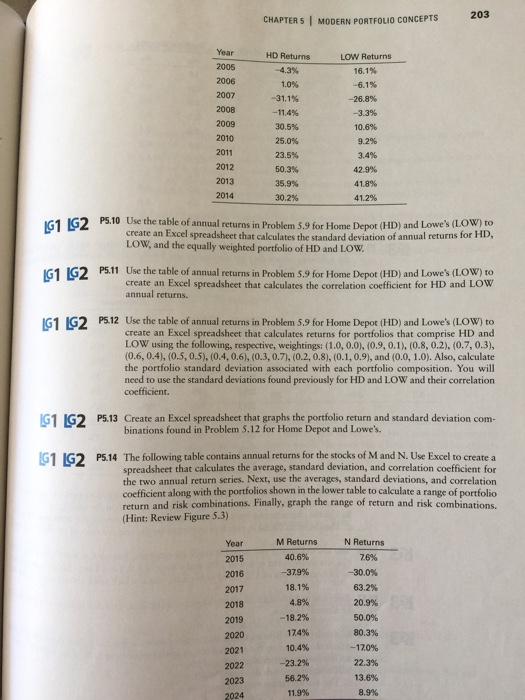
problems 12 to 14 only
203 CHAPTERS I MODERN PORTFOLIO CONCEPTS HD Returns -4.3% 1.0% -31.1% -11,4% 30.5% 25.0% 23.5% 50.3% 35.9% 30.2% LOW Returns 16.1% -61% -26.8% -3.3% 10.6% 9.2% 3.4% 42.9% 41.8% 41.2% 2006 2008 2009 2010 2011 2012 2013 2014 IG1 1G2 P5.10 Use the table of annual returns in Problem $.9 for Home Depot (HD) and Lowe's (LOW) to create an Excel spreadsheet that calculates the standard deviation of annual returns for HD, LOW, and the equally weighted portfolio of HD and LOw 51 2 P5.11 Use the table of annual returns in Problem 5.9 for Home Depot (HD) and Love's (LOW) to create an Excel spreadsheet that calculates the correlation coefficient for HD and LOW annual returns. G1 IG2 P5.12 Use the table of annual returns in Problem 5.9 for Home Depot (HD) and Lowe's (LOW) to create an Excel spreadsheet that calculates returns for portfolios that comprise HD and LOW using the following, respective, weightings: (1.0, 0.0), (0.9, 0.1), (0.8, 0.2), (0.7,0.3), (0.6, 0.4), (0.5, 0.5), (0.4,0.6), (0.3, 0.7), (0.2, 0.8), (0.1,0.9), and (0.0, 1.0). Also, calculate the portfolio standard deviation associated with each portfolio composition. You will need to use the standard deviations found previously for HD and LOW and their correlation coefficient. G1 IG2 P5.13 Create an Excel spreadsheet that graphs the portfolio return and standard deviation com- binations found in Problem 5.12 for Home Depot and Lowe's. G1 IG2 P5.14 The following table contains annual returns for the stocks of M and N. Use Excel to create a spreadsheet that calculates the average, standard deviation, and correlation coefficient for the two annual return series. Next, use the averages, standard deviations, and correlation coefficient along with the portfolios shown in the lower table to calculate a range of portfolio return and risk combinations. Finally, graph the range of return and risk combinations (Hint: Review Figure 5.3) M Returns 40.6% -379% 18.1% 4.8% -18.2% 1 74% 10.4% 23.2% 56.2% 11.9% N Returns 2015 2016 2017 2018 2019 2020 2021 2022 2023 2024 -30.0% 63.2% 20.9% 50.0% 80.3% -170% 22.3% 13.6% 8.9% 204 PART TWO IMPORTANT CONCEPTUAL TOOLS Portfolio Weights 1.0 0.0 0.1 0.9 0.8 0.2 0.3 0.4 0.5 0.6 0.7 0.6 0.5 0.4 0.3 0.7 0.8 0.9 1.0 0.2 0.1 0.0