

Answered step by step
Verified Expert Solution
Question
1 Approved Answer
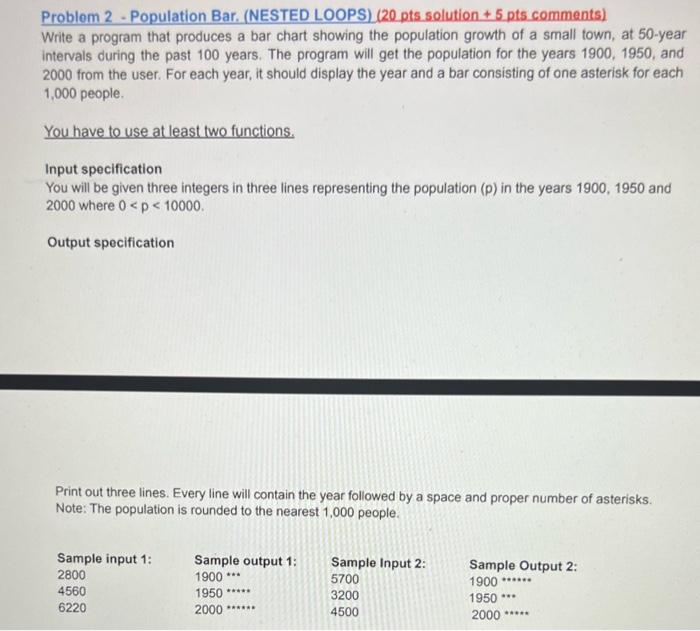
Problom 2 - Population Bar. (NESTED LOOPS) ( 20 pts solution + 5 pts comments) Write a program that produces a bar chart showing the
Step by Step Solution
There are 3 Steps involved in it
Step: 1

Get Instant Access to Expert-Tailored Solutions
See step-by-step solutions with expert insights and AI powered tools for academic success
Step: 2

Step: 3
Ace Your Homework with AI
Get the answers you need in no time with our AI-driven, step-by-step assistance
Get Started
How Do I Use A Database Research Tools You Can Use
Authors: Laura La Bella
1st Edition
1622753763, 978-1622753765