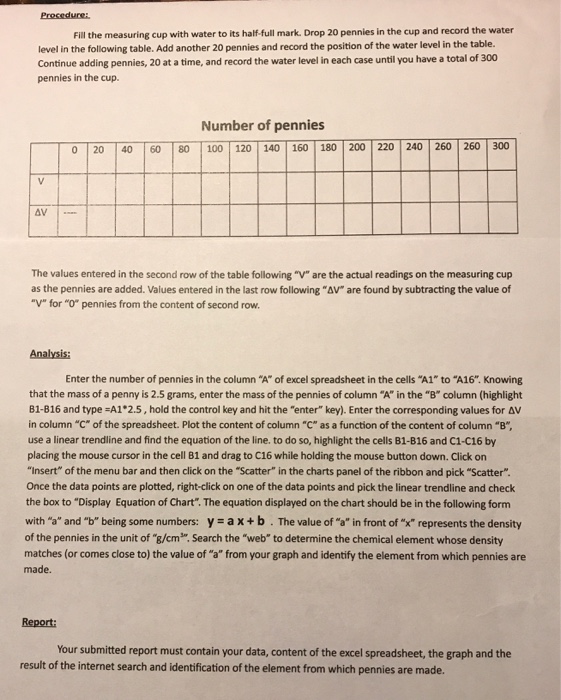
Procedure: Fill the measuring cup with water to its half-full mark. Drop 20 pennies in the cup and record the water level in the following table. Add another 20 pennies and record the position of the water level in the table. Continue adding pennies, 20 at a time, and record the water level in each case until you have a total of 300 pennies in the cup Number of pennies 0 20 40 60 80 100 120 140 160 180 200 220 240 260 260 300 The values entered in the second row of the table following "V" are the actual readings on the measuring cup as the pennies are added. Values entered in the last row following "AV" are found by subtracting the value of "V" for "O pennies from the content of second row. Analysis: Enter the number of pennies in the column "A" of excel spreadsheet in the cells "A1" to "A16". Knowing that the mass of a penny is 2.5 grams, enter the mass of the pennies of column "A" in the "B" column (highlight B1-B16 and type A1*2.5, hold the control key and hit the "enter" key). Enter the corresponding values for AV in column "C" of the spreadsheet. Plot the content of column "c" as a function of the content of columnB, use a linear trendline and find the equation of the line. to do so, highlight the cells B1-B16 and C1-C16 by placing the mouse cursor in the cell 81 and drag to C16 while holding the mouse button down. Click on "Insert" of the menu bar and then click on the "Scatter" in the charts panel of the ribbon and pick "Scatter". Once the data points are plotted, right-click on one of the data points and pick the linear trendline and check the box to "Display Equation of Chart". The equation displayed on the chart should be in the following form with "a and "b"' being some numbers: y-ax+b. The value of "a" in front of "x" represents the density of the pennies in the unit of "g/cm . Search the "web" to determine the chemical element whose density matches (or comes close to) the value of "a" from your graph and identify the element from which pennies are made. Report: Your submitted report must contain your data, content of the excel spreadsheet, the graph and the result of the internet search and identification of the element from which pennies are made. Procedure: Fill the measuring cup with water to its half-full mark. Drop 20 pennies in the cup and record the water level in the following table. Add another 20 pennies and record the position of the water level in the table. Continue adding pennies, 20 at a time, and record the water level in each case until you have a total of 300 pennies in the cup Number of pennies 0 20 40 60 80 100 120 140 160 180 200 220 240 260 260 300 The values entered in the second row of the table following "V" are the actual readings on the measuring cup as the pennies are added. Values entered in the last row following "AV" are found by subtracting the value of "V" for "O pennies from the content of second row. Analysis: Enter the number of pennies in the column "A" of excel spreadsheet in the cells "A1" to "A16". Knowing that the mass of a penny is 2.5 grams, enter the mass of the pennies of column "A" in the "B" column (highlight B1-B16 and type A1*2.5, hold the control key and hit the "enter" key). Enter the corresponding values for AV in column "C" of the spreadsheet. Plot the content of column "c" as a function of the content of columnB, use a linear trendline and find the equation of the line. to do so, highlight the cells B1-B16 and C1-C16 by placing the mouse cursor in the cell 81 and drag to C16 while holding the mouse button down. Click on "Insert" of the menu bar and then click on the "Scatter" in the charts panel of the ribbon and pick "Scatter". Once the data points are plotted, right-click on one of the data points and pick the linear trendline and check the box to "Display Equation of Chart". The equation displayed on the chart should be in the following form with "a and "b"' being some numbers: y-ax+b. The value of "a" in front of "x" represents the density of the pennies in the unit of "g/cm . Search the "web" to determine the chemical element whose density matches (or comes close to) the value of "a" from your graph and identify the element from which pennies are made. Report: Your submitted report must contain your data, content of the excel spreadsheet, the graph and the result of the internet search and identification of the element from which pennies are made