

Answered step by step
Verified Expert Solution
Question
1 Approved Answer
process strategy ollowing production cost data and the price forecast: a) On the same chart (on graph paper) plot the profit line for each option.
process strategy 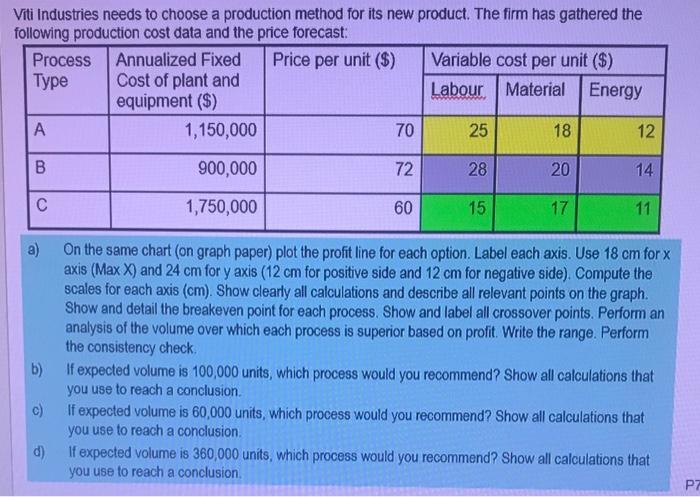
ollowing production cost data and the price forecast: a) On the same chart (on graph paper) plot the profit line for each option. Label each axis. Use 18cm for x axis (Max X) and 24cm for y axis ( 12cm for positive side and 12cm for negative side). Compute the scales for each axis (cm). Show clearly all calculations and describe all relevant points on the graph. Show and detail the breakeven point for each process. Show and label all crossover points. Perform an analysis of the volume over which each process is superior based on profit. Write the range. Perform the consistency check: b) If expected volume is 100,000 units, which process would you recommend? Show all calculations that you use to reach a conclusion. c) If expected volume is 60,000 units, which process would you recommend? Show all calculations that you use to reach a conclusion. d) If expected volume is 360,000 units, which process would you recommend? Show all calculations that you use to reach a conclusion. ollowing production cost data and the price forecast: a) On the same chart (on graph paper) plot the profit line for each option. Label each axis. Use 18cm for x axis (Max X) and 24cm for y axis ( 12cm for positive side and 12cm for negative side). Compute the scales for each axis (cm). Show clearly all calculations and describe all relevant points on the graph. Show and detail the breakeven point for each process. Show and label all crossover points. Perform an analysis of the volume over which each process is superior based on profit. Write the range. Perform the consistency check: b) If expected volume is 100,000 units, which process would you recommend? Show all calculations that you use to reach a conclusion. c) If expected volume is 60,000 units, which process would you recommend? Show all calculations that you use to reach a conclusion. d) If expected volume is 360,000 units, which process would you recommend? Show all calculations that you use to reach a conclusion Step by Step Solution
There are 3 Steps involved in it
Step: 1

Get Instant Access to Expert-Tailored Solutions
See step-by-step solutions with expert insights and AI powered tools for academic success
Step: 2

Step: 3
Ace Your Homework with AI
Get the answers you need in no time with our AI-driven, step-by-step assistance
Get Started
Corporate Audit Scams A Threat To Corporate Governance
Authors: Sachi Kheskani
1st Edition
3659490148, 978-3659490149