

Answered step by step
Verified Expert Solution
Question
1 Approved Answer
Process time at a workstation is monitored using sample mean and range control charts. Six samples of n=14 observations have been obtained and the sample
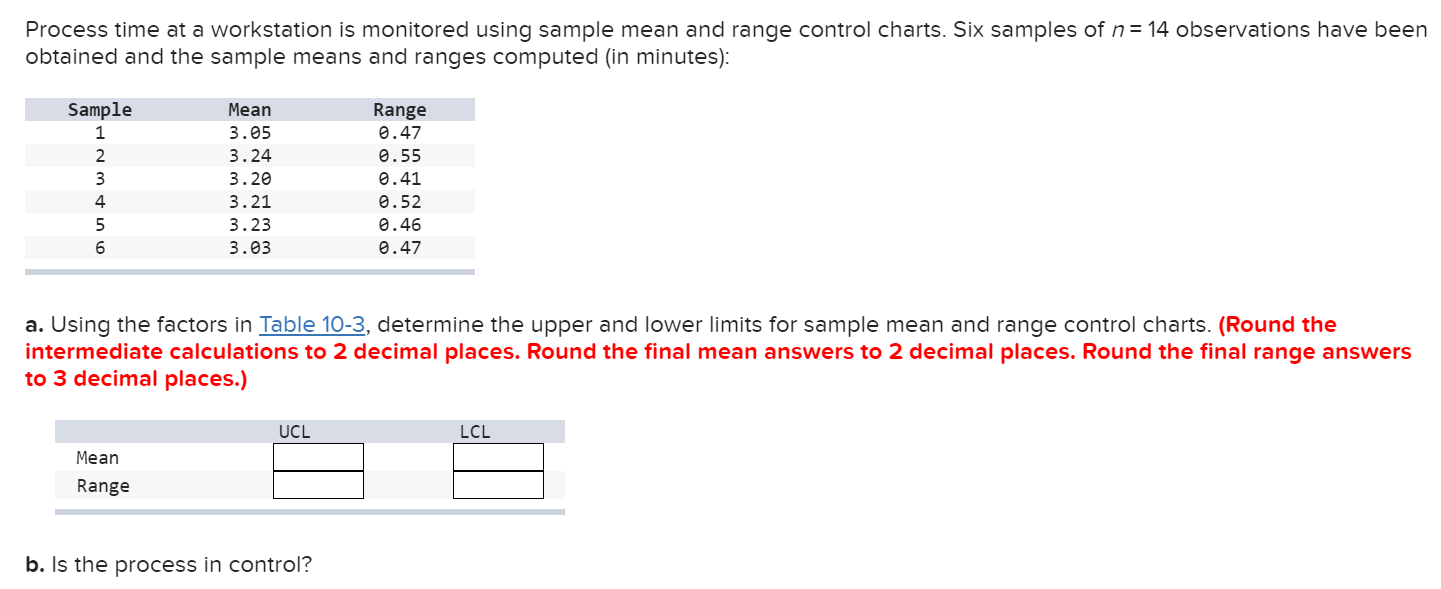 Process time at a workstation is monitored using sample mean and range control charts. Six samples of n=14 observations have been obtained and the sample means and ranges computed (in minutes): a. Using the factors in Table 10-3, determine the upper and lower limits for sample mean and range control charts. (Round the intermediate calculations to 2 decimal places. Round the final mean answers to 2 decimal places. Round the final range answers to 3 decimal places.) b. Is the process in control
 Step by Step Solution
There are 3 Steps involved in it
Step: 1

Get Instant Access to Expert-Tailored Solutions
See step-by-step solutions with expert insights and AI powered tools for academic success
Step: 2

Step: 3
Ace Your Homework with AI
Get the answers you need in no time with our AI-driven, step-by-step assistance
Get Started
The Fundamentals Of Fashion Management
Authors: Susan Dillon
2nd Edition
1474271219, 978-1474271219