

Question: Produce a frequency table and a pie chart for RACE. Summarize the results. (Note that 0 = White and 1= Black). Construct a 95% confidence
Produce a frequency table and a pie chart for RACE. Summarize the results. (Note that 0 = White and 1= Black).
Construct a 95% confidence interval around the sample mean of JAILCREDIT and AGEADMIT, respectively. Interpret and summarize your results.
Assume that the average age of offenders at prison admissions in the state of Florida is 30. Use the data to perform a hypothesis test to determine if the average age of offenders at prison admissions in your sample is significantly different from the average age in the offender population in Florida. The variable that measures the average age of offenders at prison admission is AGEADMIT. Use a .05 level of statistical significance. Run the one-sample t-test in Excel. In your summary, please discuss the null hypothesis, alternative hypothesis, the result of this hypothesis test, and interpret the result.
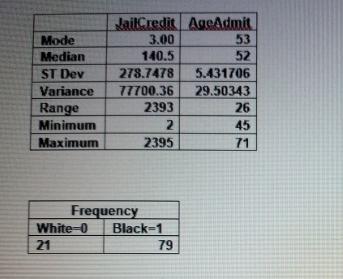
JailCredit AgeAdmit 53 52 Mode 3.00 Median 140.5 ST Dev 278.7478 5.431706 Variance 77700.36 29.50343 2393 26 Range Minimum 2. 45 Maximum 2395 71 Frequency White-0 Black=1 21 79
Step by Step Solution
3.42 Rating (155 Votes )
There are 3 Steps involved in it
since i have attempted similar questions long beforehappy to help every stud... View full answer

Get step-by-step solutions from verified subject matter experts