Answered step by step
Verified Expert Solution
Question
1 Approved Answer
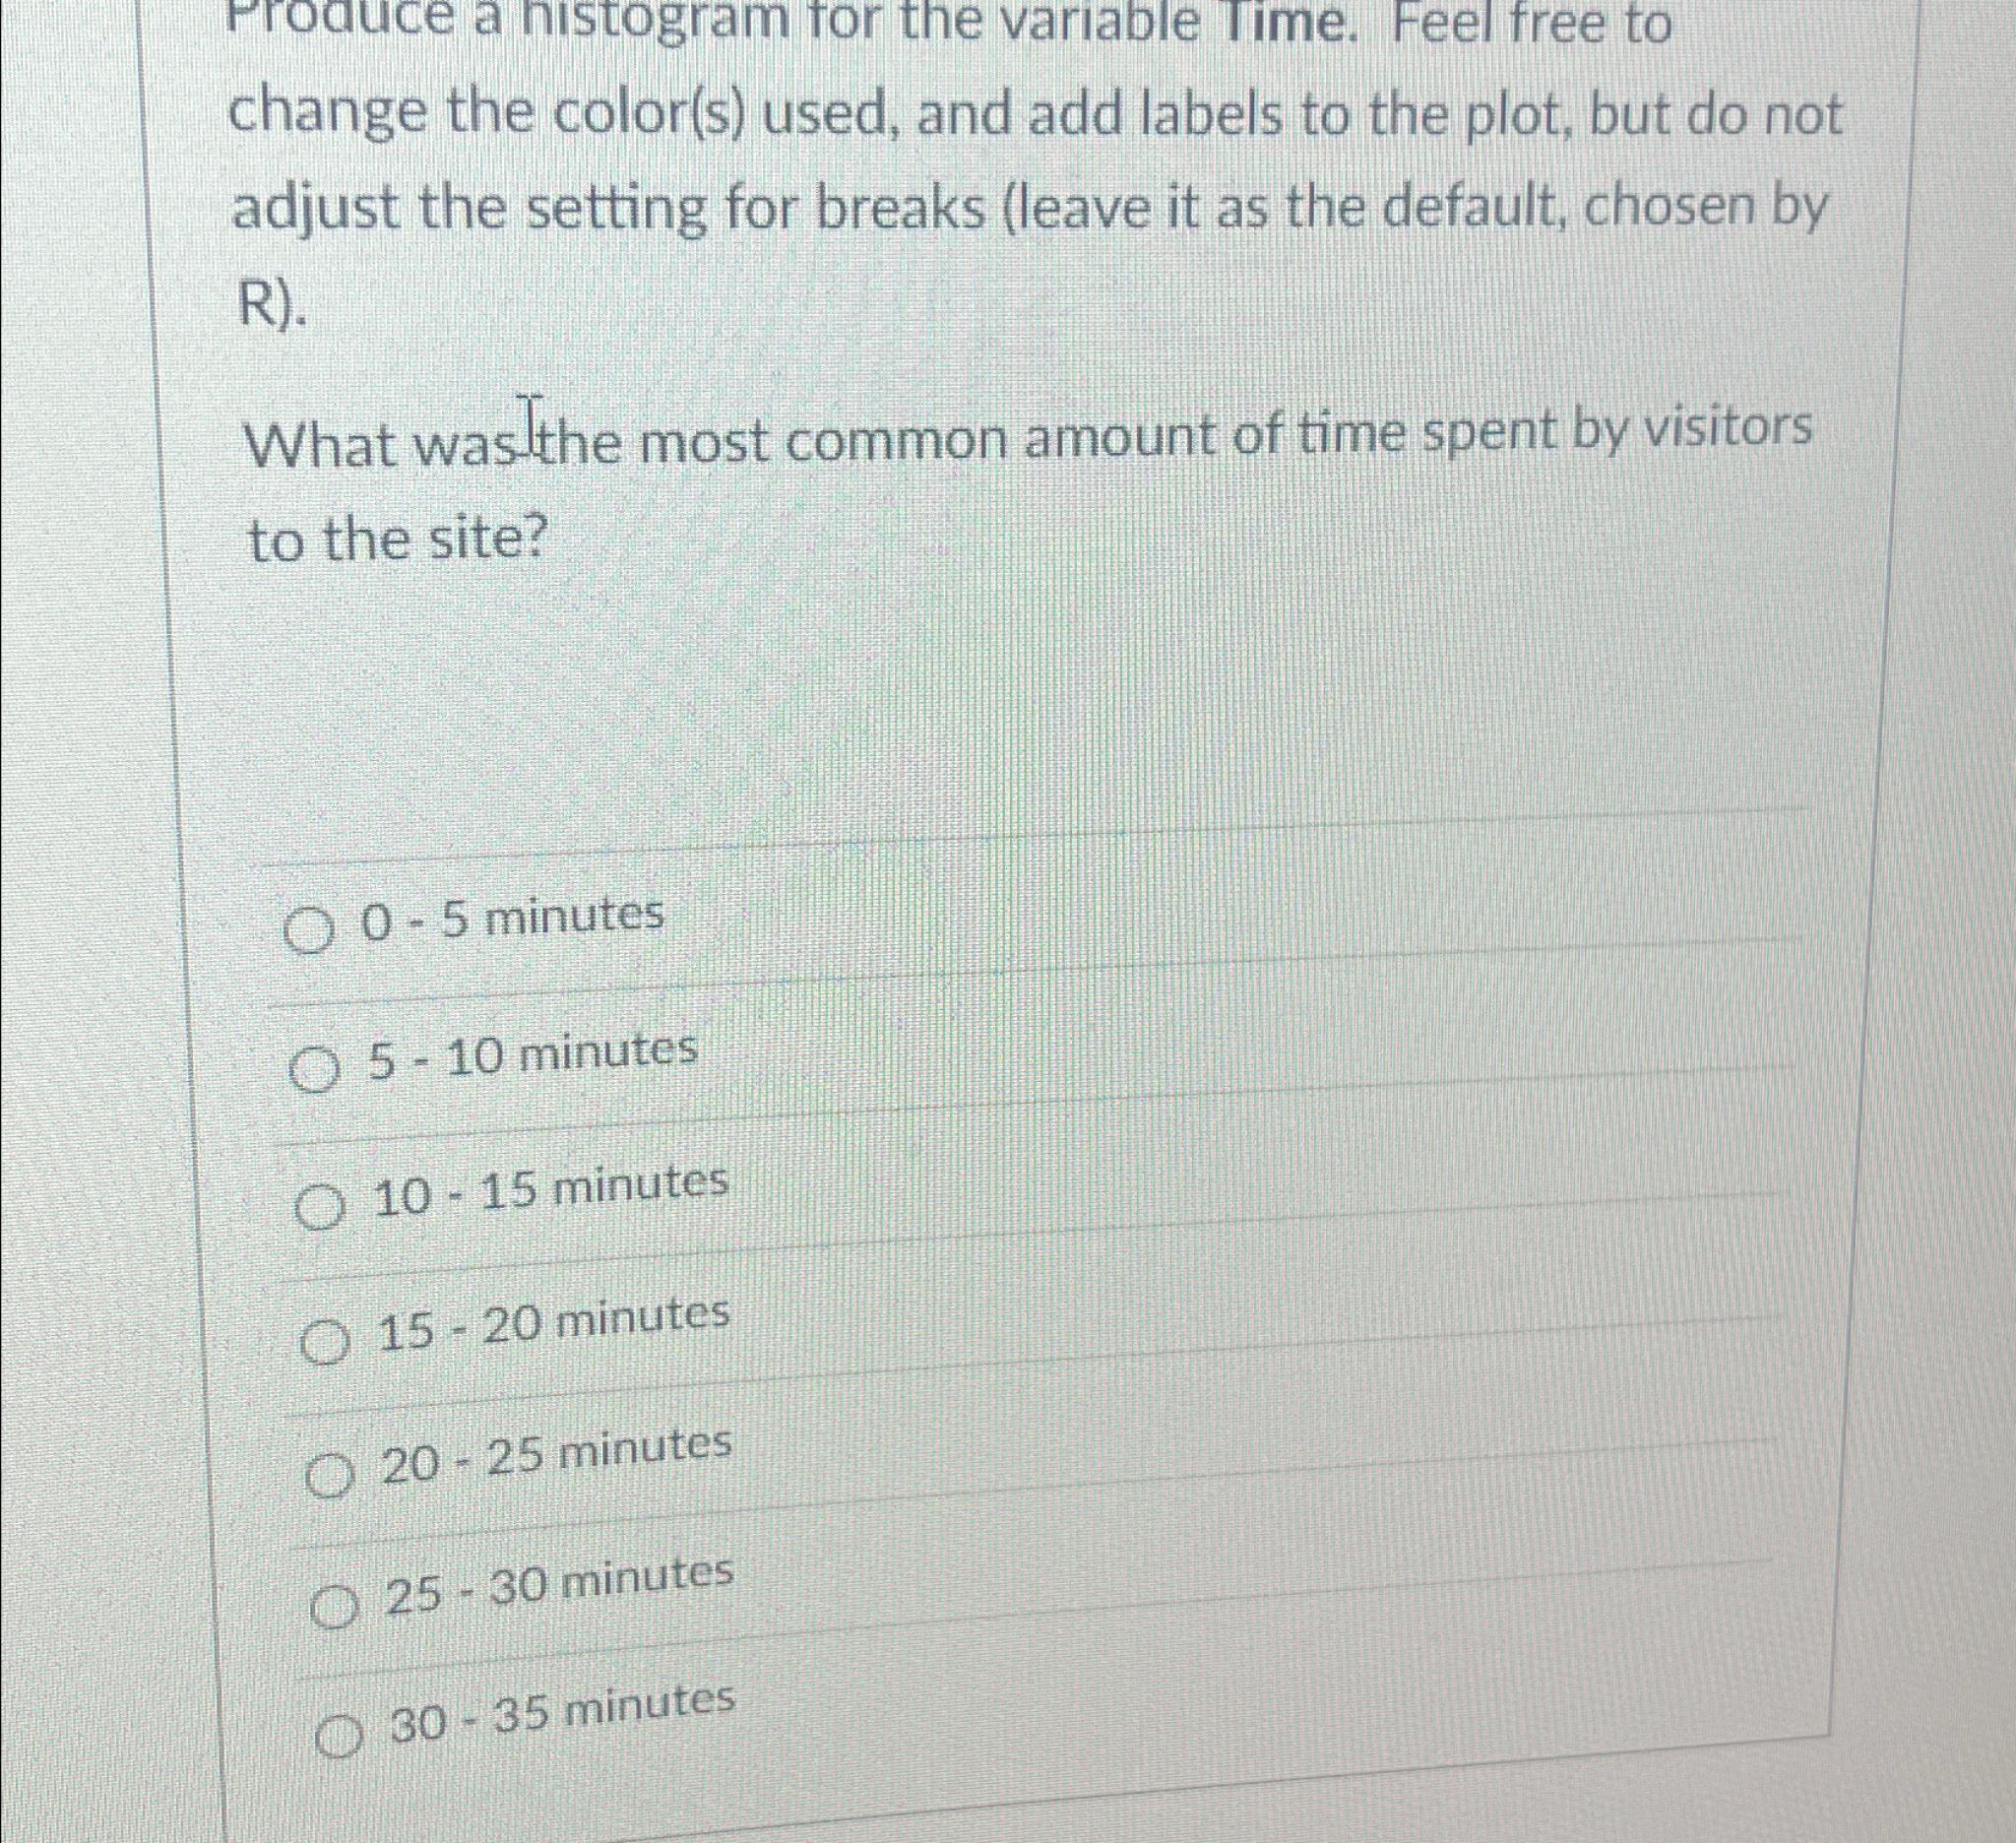
Produce a histogram for the variable Time. Feel free to change the color ( s ) used, and add labels to the plot, but do
Produce a histogram for the variable Time. Feel free to change the colors used, and add labels to the plot, but do not adjust the setting for breaks leave it as the default, chosen by R
What was the most common amount of time spent by visitors to the site?
minutes
minutes
minutes
minutes
minutes
minutes
minutes

Step by Step Solution
There are 3 Steps involved in it
Step: 1

Get Instant Access to Expert-Tailored Solutions
See step-by-step solutions with expert insights and AI powered tools for academic success
Step: 2

Step: 3

Ace Your Homework with AI
Get the answers you need in no time with our AI-driven, step-by-step assistance
Get Started


